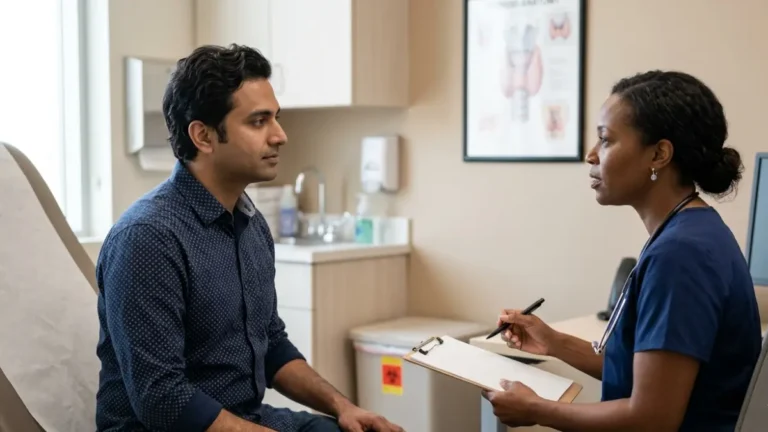
Know Where You Fit in Today’s Thyroid Screening Guidelines
Thyroid screening isn't one-size-fits-all. In a trial of 737 adults 65+, treating mildly high TSH showed no apparent benefit. Here's who should still test.

Thyroid screening isn't one-size-fits-all. In a trial of 737 adults 65+, treating mildly high TSH showed no apparent benefit. Here's who should still test.
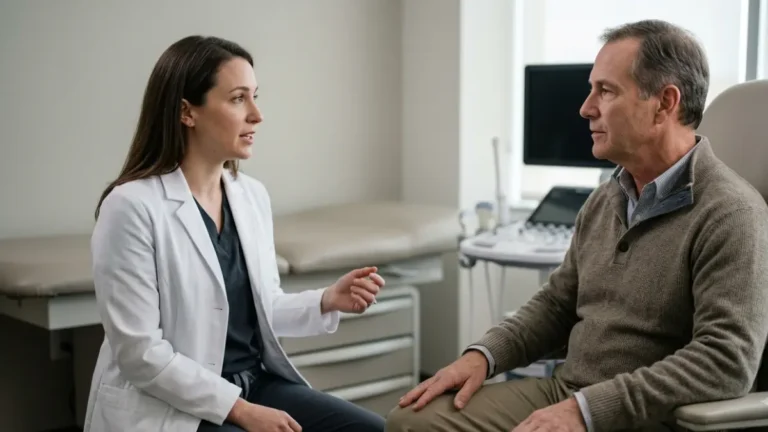
TSH suppression in thyroid cancer carries trade-offs: in 771 low- and intermediate-risk patients, it raised osteoporosis risk without reducing recurrence.
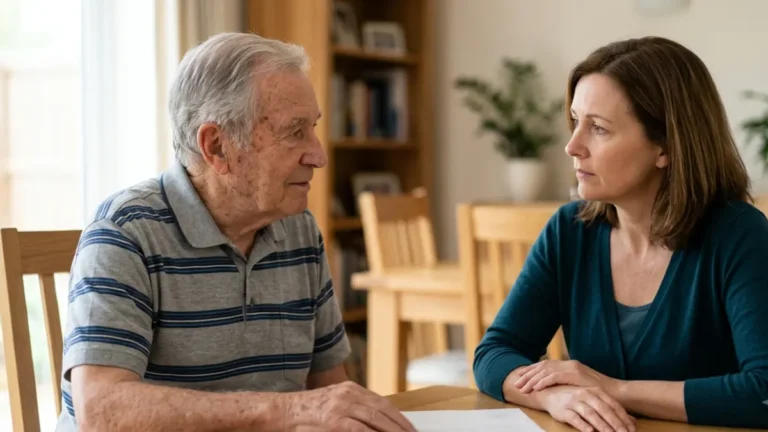
Thyroid test results for older parents need age context: TSH can run higher after 80 even when the thyroid is healthy. Here's how to read them.

Myxedema coma rarely means a true coma. Most people are confused or drowsy instead, which is exactly why families can miss the warning signs.
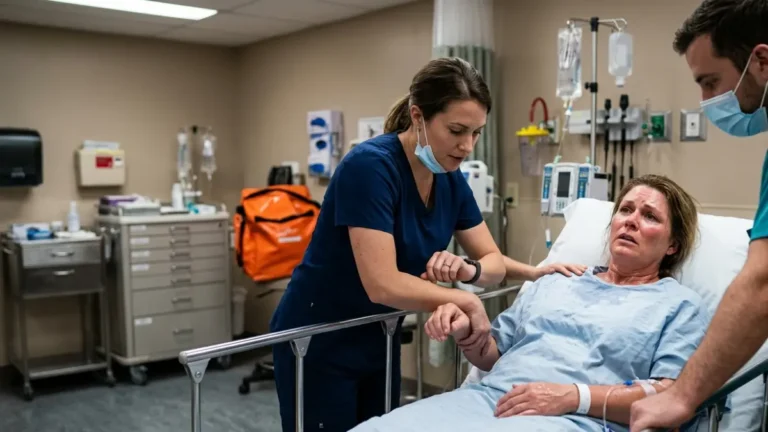
Thyroid storm symptoms overlap with a bad hyperthyroid day until fever, pulse and mental state shift together. Reported death rates span 1.2% to 25%.
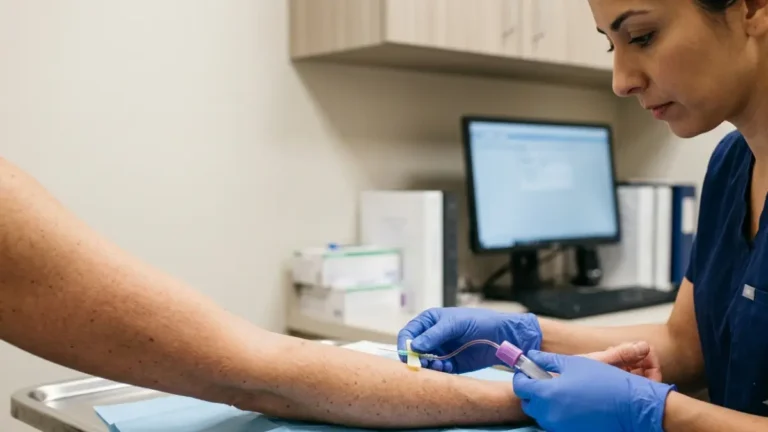
Dangerous TSH levels rarely mean an emergency on their own — above 10 or below 0.1 mIU/L changes treatment; confusion or fever changes the timeline.
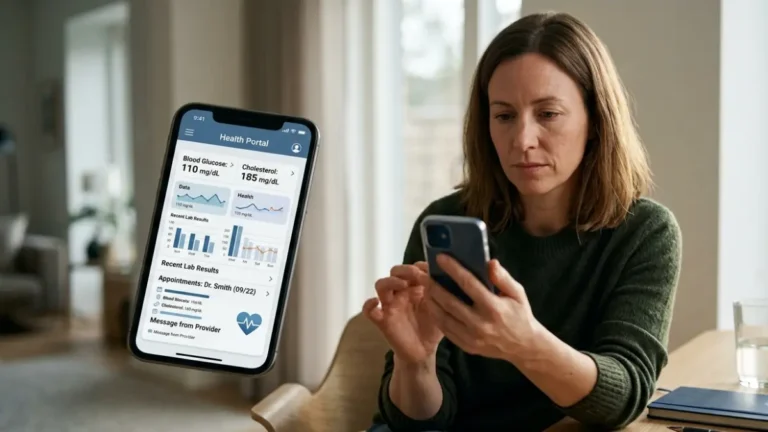
TSH over 10 is where the outcome data shifts. Pooled cohort studies found no measurable heart-event increase below 7, but a clear rise at 10 and above.
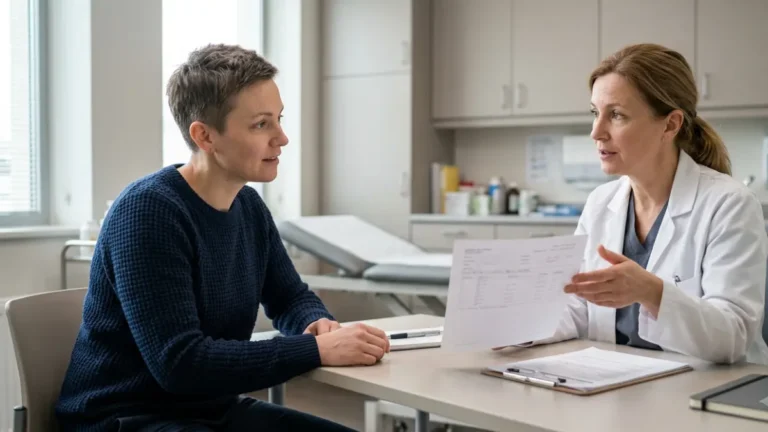
TSH vs free T4 answer different questions — and TPO antibodies a third. In a national US sample, 11.3% tested antibody-positive. Here's what each adds.
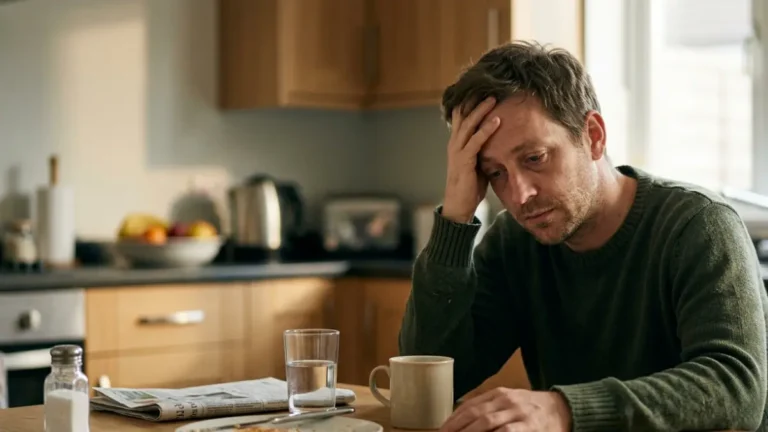
Normal TSH but still tired? A normal result rules out the common hypothyroidism, not the rare form that shows only on free T4 — or low iron and B12.
Levothyroxine vs Armour Thyroid: 1.5 million US patients filled prescriptions for an unapproved thyroid drug in 2024. What it means for your refill.
Levothyroxine absorption interactions are measurable: in one 12-week trial, taking iron alongside the dose moved mean TSH from 1.6 to 5.4 mU/L.