Body Fat Percentage Calculator
Estimate body fat percentage using circumference measurements, compare a BMI-based body fat estimate, review fat mass and lean mass, evaluate waist-to-height ratio, and get a more detailed body-composition snapshot in one mobile-friendly tool.
Inputs
What this calculator uses
Primary U.S. Navy circumference estimate plus a BMI-based comparison estimate, with body-composition breakdown and waist-to-height context.
Important
This is an educational estimate. Body-fat measurements can vary depending on tape placement, breathing, posture, time of day, and the method used.
Results
Estimated body fat percentage
—
Primary method: U.S. Navy circumference estimate.
Body fat category
—
Category uses sex-specific body-fat ranges.
Fat mass
—
Estimated amount of body weight coming from fat mass.
Lean mass
—
Estimated body weight remaining after subtracting fat mass.
BMI overview
—
Category: —
BMI-based body fat estimate
—
Secondary comparison estimate using BMI, sex, and age.
Simple average of both methods
—
Useful only as a comparison view, not a diagnostic standard.
Waist-to-height ratio
—
—
Fat-free percentage
—
The remainder after subtracting estimated body fat percentage from 100%.
Body weight entered
—
Used to estimate fat mass and lean mass.
Sex used for ranges
—
Body-fat interpretation ranges differ for men and women.
Detailed comparison
Primary estimate: — • BMI-based comparison: — • Average comparison view: —
—
Interpretation table
| Metric | Value | How to read it |
|---|---|---|
| Primary body fat estimate | — | Your main circumference-based body fat percentage estimate. |
| Fat mass | — | The estimated amount of total body weight attributable to body fat. |
| Lean mass | — | The estimated non-fat portion of body weight, including muscle, bone, organs, and body water. |
| Waist-to-height ratio | — — | A central-adiposity screening measure that can add context beyond total weight alone. |
| BMI-based comparison estimate | — | A secondary estimate using BMI and age, useful for comparison rather than precise measurement. |
| Fat-free percentage | — | The approximate percentage of body weight not assigned to fat mass in the primary estimate. |
Method comparison table
| Method | Estimated body fat % | How to read it |
|---|
Healthy range comparison
| Reference point | Reference body fat % | Your difference | How to read it |
|---|
Results appear after you click “Calculate.”
Understanding Body Fat Percentage – Your Complete Guide
Body fat percentage measures the exact proportion of your total weight composed of adipose tissue versus lean mass (muscle, bone, organs, water). Unlike the outdated Body Mass Index (BMI) that only considers height and weight, body fat percentage reveals your true health status—a groundbreaking 2024 JAMA study proved it predicts mortality risk 1.78 times more accurately than BMI alone.
How to Use This Body Fat Percentage Calculator
Our free calculator uses the validated US Navy circumference method (±3-4% accuracy) combined with BMI-based estimation—no expensive equipment needed.

Required Measurements:
For Men (3 measurements):
- Height (in inches or centimeters)
- Neck circumference (measure at narrowest point below Adam’s apple)
- Waist circumference (at navel level, relaxed abdomen)
For Women (4 measurements):
- Height
- Neck circumference
- Waist circumference (at narrowest point between ribs and hips)
- Hip circumference (at widest point around buttocks)
What You’ll Get Instantly:
✓ Body fat percentage with ±3-4% medical-grade accuracy
✓ Health risk category (Athletes, Fitness, Acceptable, Overweight, Obese)
✓ Fat mass vs lean mass breakdown in kg and pounds
✓ Waist-to-height ratio (visceral fat risk indicator)
✓ BMR & TDEE (daily calorie needs for weight management)
✓ Ideal body weight using Devine formula
Pro tip: Use a flexible tape measure, keep it snug but not compressing tissue, and measure at the same time of day for consistent tracking.
Ideal Body Fat Percentage by Sex and Age
What’s “healthy” varies dramatically by sex and life stage. Here’s what the research shows:
| Category | Men | Women | Health Status |
|---|---|---|---|
| Essential Fat | 2-5% | 10-13% | Minimum for survival |
| Athletes | 6-13% | 14-20% | Competitive sports range |
| Fitness | 14-17% | 21-24% | Optimal health zone |
| Acceptable | 18-24% | 25-31% | Average/moderate risk |
| Overweight | 25-29% | 32-39% | Increased disease risk |
| Obese | ≥30% | ≥40% | High risk, medical intervention |
Why women need higher body fat: Female essential fat (10-13%) supports reproductive hormones, menstruation, pregnancy, and lactation. Body fat below 15% often disrupts ovulation and fertility.
Age adjustments: Healthy ranges increase slightly after age 60—men 18-26%, women 25-35%—as preventing muscle loss becomes the priority over ultra-low body fat.
Body Fat Percentage vs BMI: Why Your Doctor Should Measure Both
| Metric | What It Measures | Accuracy for Health | Can Miss |
|---|---|---|---|
| Body Fat % | Actual adipose tissue | High—predicts mortality 1.78× better | Requires measurement tools |
| BMI | Weight-to-height ratio only | Low—can’t distinguish muscle from fat | Athletes (false “overweight”), skinny fat (false “normal”) |

The “skinny fat” problem: Research shows 30% of adults with normal BMI have dangerously elevated body fat percentages and face metabolic syndrome risks identical to clinically obese individuals. BMI would classify them “healthy” while they develop type 2 diabetes, cardiovascular disease, and fatty liver.
The athlete paradox: Muscular individuals often score “overweight” or “obese” on BMI scales despite having exceptional body fat percentages (12-15%) and cardiovascular health. Body fat measurement reveals the truth BMI obscures.
Why This Calculator Beats Competitors
- Medical validation: The US Navy method correlates within 3-4% of DEXA scans (the $150 gold standard) in peer-reviewed studies involving thousands of subjects against hydrostatic weighing.
- No equipment needed: Unlike $200 BIA scales (with 21-34% error rates), skinfold calipers requiring trained technicians, or $75 Bod Pod tests, you only need a $5 tape measure.
- Comprehensive results: While competitors like Calculator.net provide just a single number, you receive 8 distinct health metrics including visceral fat risk, metabolic rate, and body composition breakdown.
- Expert-backed: Developed and reviewed by our team of 21 medical professionals with 10-25 years clinical experience across endocrinology, bariatrics, sports medicine, and nutrition science.
Essential vs Storage Fat: Understanding Your Body’s Requirements
Your body fat serves critical functions beyond energy storage—going too low is as dangerous as too high.
Essential fat (non-negotiable minimum):
- Men: 2-5% | Women: 10-13%
- Protects vital organs and nervous system
- Enables hormone production (testosterone, estrogen, leptin)
- Supports vitamin absorption (A, D, E, K are fat-soluble)
- Regulates body temperature
Dropping below essential fat triggers: Hormonal shutdown, immune suppression, bone density loss, cardiac arrhythmias, and organ damage. Competitive bodybuilders reach 4-6% only temporarily for contests—impossible to sustain.
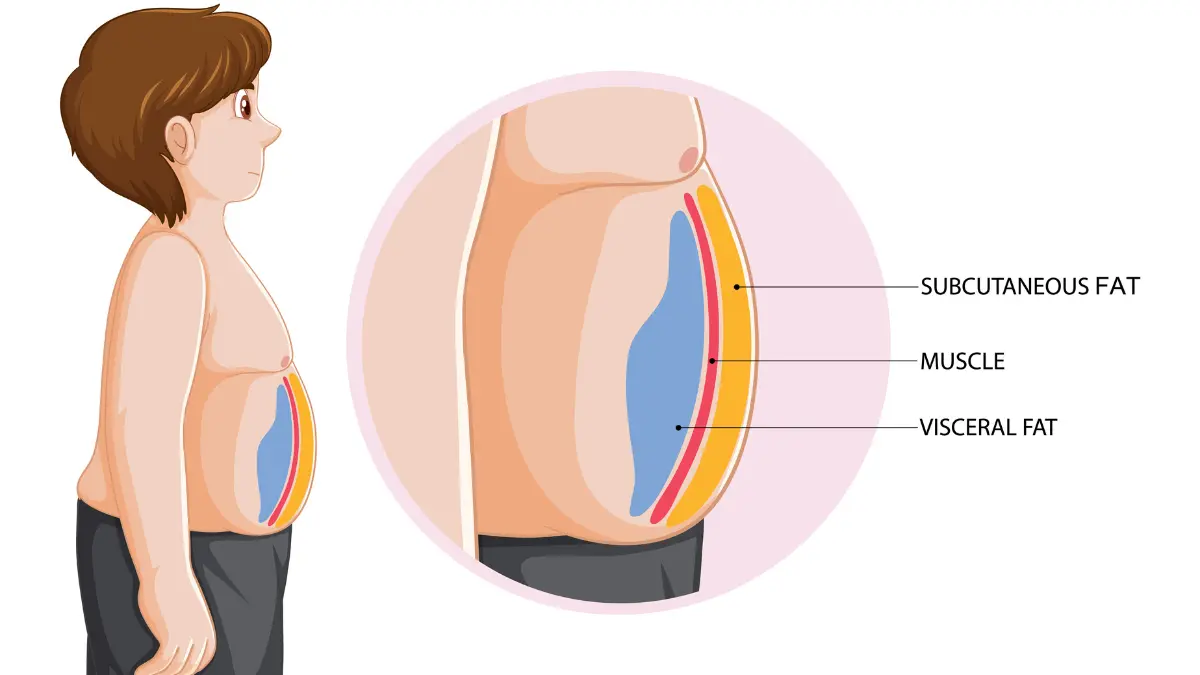
Storage fat (subcutaneous vs visceral):
Subcutaneous fat (under skin): Relatively harmless, stores energy, provides insulation. While excess indicates caloric surplus, it doesn’t actively harm metabolism.
Visceral fat (around organs): The dangerous type. Visceral adipose tissue secretes inflammatory proteins (cytokines) that promote insulin resistance, elevate blood pressure, and accelerate heart disease. According to the American Heart Association, every 2-inch waist increase = 10% higher cardiovascular risk—even at normal body weight.
Your waist-to-height ratio (calculated above) reveals visceral accumulation: aim for <0.5 (waist under half your height). National Institute for Health and Care Excellence now recommends this metric over BMI for cardiovascular screening.
Body Fat as the Superior Mortality Predictor
The Centers for Disease Control reports over 73% of American adults qualify as overweight or obese by BMI—but this binary classification fails to identify who faces actual health danger.
The definitive research: Adults with body fat ≥27% (men) or ≥44% (women) experience:
- 1.78-fold increased all-cause mortality (adjusted for age, smoking, activity)
- 3.62-fold increased cardiovascular mortality
- Significantly elevated type 2 diabetes, 13 cancer types, and dementia risks
These risks persist independent of BMI, blood pressure, cholesterol, or family history—positioning body fat assessment as essential for comprehensive health evaluation recommended by the World Health Organization obesity guidelines.
Your next step: Enter your measurements in the calculator above, then explore the detailed charts, health risk categories, and evidence-based reduction strategies in the sections below to understand exactly what your numbers mean and how to optimize them safely.
Body Fat Measurement Methods – Which One Is Right for You?
Choosing the right body fat measurement method determines whether you get clinically useful data or misleading numbers. With accuracy ranging from ±1% (DEXA gold standard) to ±34% (cheap home scales), understanding your options ensures you’re tracking real progress—not measurement error.
How Accurate Is This Calculator?
The US Navy circumference method used in our calculator delivers ±3-4% accuracy—on par with professional BIA devices costing $50-100 per test—validated against hydrostatic weighing (the research gold standard) in studies involving thousands of military personnel.
What this means practically: If the calculator shows 22% body fat, your true percentage falls between 18-26%. This accuracy level is sufficient for:
- Assessing health risk category
- Tracking fat loss progress over weeks/months
- Determining if medical intervention is needed
- Athletic body composition monitoring
When you need better precision: Baseline medical evaluation, pre/post bariatric surgery, or achieving very low body fat (<10% men, <18% women) warrant DEXA scanning at ±1-2.7% accuracy.
Complete Method Comparison: Lab to Living Room
| Method | Accuracy | Cost | Time | Where Available | Best For |
|---|---|---|---|---|---|
| Multi-Compartment Model | ±0.5-1% | $$$$ | 60+ min | Research labs only | Gold standard validation |
| DEXA Scan | ±1-2.7% | $50-150 | 10 min | Medical facilities | Baseline assessment, visceral fat |
| Hydrostatic Weighing | ±1-3% | $50-100 | 20 min | Universities, specialty centers | Athletic testing |
| Bod Pod (ADP) | ±2-4% | $40-75 | 5 min | Universities, fitness facilities | Regular athlete tracking |
| Medical Ultrasound | ±2-4% | Medical | 30 min | Clinical only | Tissue visualization |
| Professional BIA | ±3-5% | $50-100 | 5 min | Gyms, clinics (InBody) | Trend tracking |
| US Navy Method ⭐ | ±3-4% | FREE | 2 min | Home (tape measure) | Screening, home monitoring |
| Skinfold Calipers | ±3.5-5% | $5-50 | 10 min | Anywhere (trained user) | Fitness tracking |
| Consumer BIA Scales | ±21-34% | $20-200 | 1 min | Home | Trends only (not absolute) |
| BMI-Based Formulas | ±4-5% | Free | 1 min | Anywhere | Rough initial estimate |
Why the US Navy Method Works
Developed for military field assessment where expensive lab equipment isn’t available, this validated formula correlates circumference measurements with body fat through mathematical relationships proven across diverse populations.
The science behind it:
- Neck circumference inversely correlates with body fat (leaner individuals have proportionally larger necks relative to body fat)
- Waist circumference strongly predicts dangerous visceral adiposity
- Hip circumference (women) accounts for gynoid (lower body) fat distribution patterns
- Height normalizes measurements across different body sizes
Validation data: Studies comparing Navy method to hydrostatic weighing show correlation coefficients of 0.84-0.92, with standard error of estimate 3-4%—matching or exceeding consumer devices costing hundreds of dollars.
Gold Standard Laboratory Methods
DEXA Scan (Dual-Energy X-ray Absorptiometry)
The clinical benchmark uses low-dose X-rays to differentiate bone, lean tissue, and fat mass with exceptional regional detail.
Unique advantages:
- Measures visceral fat separately (the dangerous organ fat)
- Regional breakdown (arms, legs, trunk, android/gynoid zones)
- Bone density assessment (osteoporosis screening)
- Coefficient of variation: 0.8-2.7% for fat mass
Cost/access: $50-150 per scan at medical imaging centers, hospitals, or research universities. Not practical for frequent measurements but ideal for establishing accurate baseline.
Hydrostatic (Underwater) Weighing
- Based on Archimedes’ principle—measures body density by comparing weight on land versus fully submerged in water after maximum exhalation.
- Why it’s the research standard: ±1-3% error when performed correctly, minimal technological complexity, well-validated across all populations and body types.
- Practical limitations: Requires specialized tank, uncomfortable (full submersion + breath-holding), limited availability (primarily university research centers).
Bod Pod (Air Displacement Plethysmography)
- Measures body volume using air displacement in an egg-shaped chamber—same principle as hydrostatic weighing without the water discomfort.
- Athlete preference: ±2-4% accuracy, quick (5 minutes), comfortable, excellent repeatability for tracking training cycles and competition prep.
- Cost/availability: $40-75 per test at universities, sports medicine facilities, and premium fitness centers.
Clinical & At-Home Methods
Bioelectrical Impedance Analysis (BIA)
Sends weak electrical current through your body—fat resists electricity while muscle/water conduct it readily, estimating composition from resistance patterns.
Critical accuracy distinction:
- Professional devices (InBody, Tanita medical): ±3-5% error when properly calibrated
- Consumer home scales: ±21-34% error (Consumer Reports testing)
Massive variability factors:
- Hydration status (24-hour fluctuation affects readings 40%)
- Meal timing (2-4 hours post-eating alters conductivity)
- Exercise (wait 12+ hours after intense workout)
- Women: menstrual cycle phase, skin temperature, electrode contact
Research warning: Coefficient of variation for BIA fat mass reaches 40%—meaning two readings taken hours apart can differ dramatically. Never use home BIA scales for precise body fat determination; reserve only for identifying trends over weeks/months using identical conditions (same time/day, fasted state, post-bathroom).
Skinfold Calipers
Trained technicians pinch subcutaneous fat at 3-7 standardized body sites with precision calipers, applying population-specific equations.
Accuracy depends on expertise:
- Experienced measurer: ±3.5% error
- Self-measurement: ±5-10% error
- Obese individuals: Significant underestimation (measures 51.98% less abdominal fat than ultrasound)
Best practices: Same technician performs all measurements, consistent site identification, multiple measurements averaged per site. Excellent for lean-to-moderate body fat tracking in fitness contexts.
Calculate Body Fat at Home: Your Options
Free methods requiring only tape measure:
- US Navy circumference (our calculator) ⭐ — Best accuracy-to-convenience ratio
- Waist-to-height ratio — Visceral fat screening
- BMI-based formulas — Rough estimate when circumferences unavailable
Budget equipment ($5-50):
- Quality tape measure ($5-10) — Essential for Navy method accuracy
- Skinfold calipers ($10-50) — Requires learning proper technique via videos
Investment equipment ($20-200):
- Consumer BIA scales — Use ONLY for trends, not absolute values
When to Upgrade to Professional Testing
Schedule DEXA scan if:
- Starting medical weight loss program or considering bariatric surgery
- Body fat >30% women or >25% men with metabolic symptoms
- Suspected high visceral fat (waist-to-height ratio >0.6)
- Athletic body fat goals requiring precision (<10% men, <18% women)
- Tracking osteoporosis risk (bone density measurement)
Professional BIA appropriate for:
- Monthly progress tracking with same device/conditions
- Gym/clinic already has equipment included in membership
- Desire for segmental analysis (arm/leg/trunk breakdown)
The National Institutes of Health recommends professional body composition assessment as part of comprehensive metabolic evaluation, particularly when CDC obesity treatment guidelines suggest intervention warranted.
Your Practical Action Plan
- For health screening & home monitoring:
→ Use our US Navy calculator above (free, ±3-4% accuracy, 2 minutes) - For establishing medical baseline:
→ Schedule DEXA scan ($50-150) at imaging center for visceral fat quantification - For athletic performance tracking:
→ Quarterly Bod Pod ($40-75) or professional BIA at same facility for consistency - For budget fitness tracking:
→ Learn skinfold caliper technique ($30 calipers + YouTube tutorials) OR stick with Navy method
The best measurement method is the one you’ll use consistently under identical conditions. For 95% of people, the US Navy circumference method provides sufficient accuracy to assess health risks and track meaningful progress without cost barriers—making expensive equipment unnecessary unless medical precision required.
Body Fat Percentage Charts – What Your Numbers Really Mean
Your body fat percentage number only matters when you understand what health risks or benefits it predicts. This section translates percentages into actionable health intelligence—from disease risk stratification to athletic performance zones—so you know exactly where you stand and whether medical intervention is needed.
Body Fat Percentage Chart for Men by Age
Men naturally maintain lower body fat than women due to higher testosterone levels and greater muscle mass. However, healthy ranges increase slightly with age as metabolism slows and muscle naturally declines without intervention.
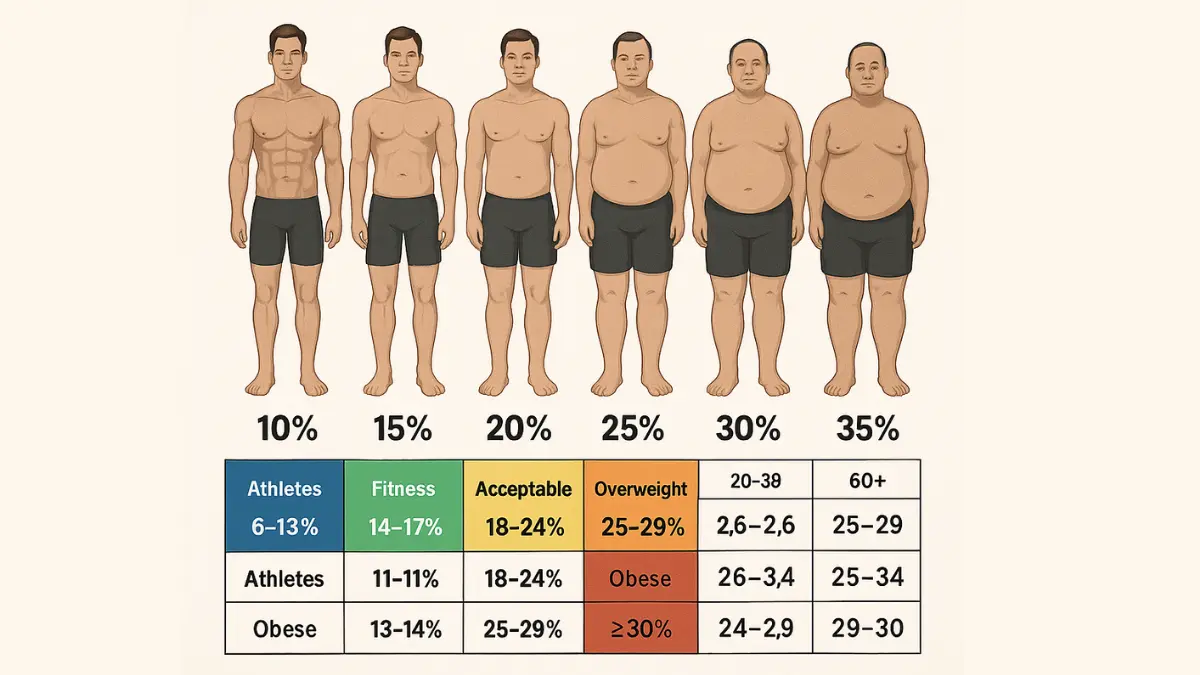
| Age Group | Essential Fat | Athletes | Fitness | Acceptable | Overweight | Obese |
|---|---|---|---|---|---|---|
| 20-29 | 2-5% | 6-13% | 14-17% | 18-24% | 25-29% | ≥30% |
| 30-39 | 2-5% | 6-14% | 15-18% | 19-25% | 26-30% | ≥31% |
| 40-49 | 3-6% | 7-15% | 16-19% | 20-26% | 27-31% | ≥32% |
| 50-59 | 3-7% | 8-16% | 17-20% | 21-27% | 28-32% | ≥33% |
| 60+ | 4-8% | 9-17% | 18-21% | 22-28% | 29-33% | ≥34% |
Source: American Council on Exercise guidelines, validated against DEXA measurements
What Each Men’s Category Means for Your Health
- Essential Fat (2-5%): Dangerous minimum—below this risks organ failure, hormonal shutdown, cardiac arrhythmias, and immune collapse. Competitive bodybuilders reach 4-6% temporarily for contests but cannot sustain it. Immediate medical evaluation required.
- Athletes (6-13%): Elite performance zone for competitive sports. While associated with peak athletic ability, maintaining single-digit body fat demands rigorous nutrition and may compromise immune function. Professional athletes undergo regular hormone panels and bone density scans.
- Fitness (14-17%): Optimal longevity zone. Research consistently shows this range associates with lowest all-cause mortality, excellent insulin sensitivity, and superior cardiovascular markers. Visible muscle definition without health compromise.
- Acceptable (18-24%): Healthy for general population. Lower end (18-20%) remains metabolically excellent; upper end (22-24%) begins showing mild insulin resistance and elevated inflammatory markers (C-reactive protein >1.0 mg/L).
Overweight (25-29%): Increased disease risk territory. According to National Institute of Diabetes and Digestive and Kidney Diseases:
- Type 2 diabetes risk increases 1.5× baseline
- Fatty liver disease (NAFLD) present in 60-70%
- Sleep apnea risk climbs significantly above 27%
- Blood pressure typically 130-139/85-89 mmHg (prehypertension)
Obese (≥30%): High-risk category. World Health Organization data shows:
- 2-4× baseline mortality risk
- Type 2 diabetes in nearly 90% of cases
- Cardiovascular disease leading cause of death
- 13 cancer types with elevated risk
- Medical action: Comprehensive metabolic panel, lifestyle program, consider pharmacotherapy if ≥35%
Body Fat Percentage Chart for Women by Age
Women require higher essential fat (10-13%) for reproductive health, hormone regulation, and fertility. Ranges increase slightly post-menopause as declining estrogen shifts fat distribution toward more dangerous visceral deposits.
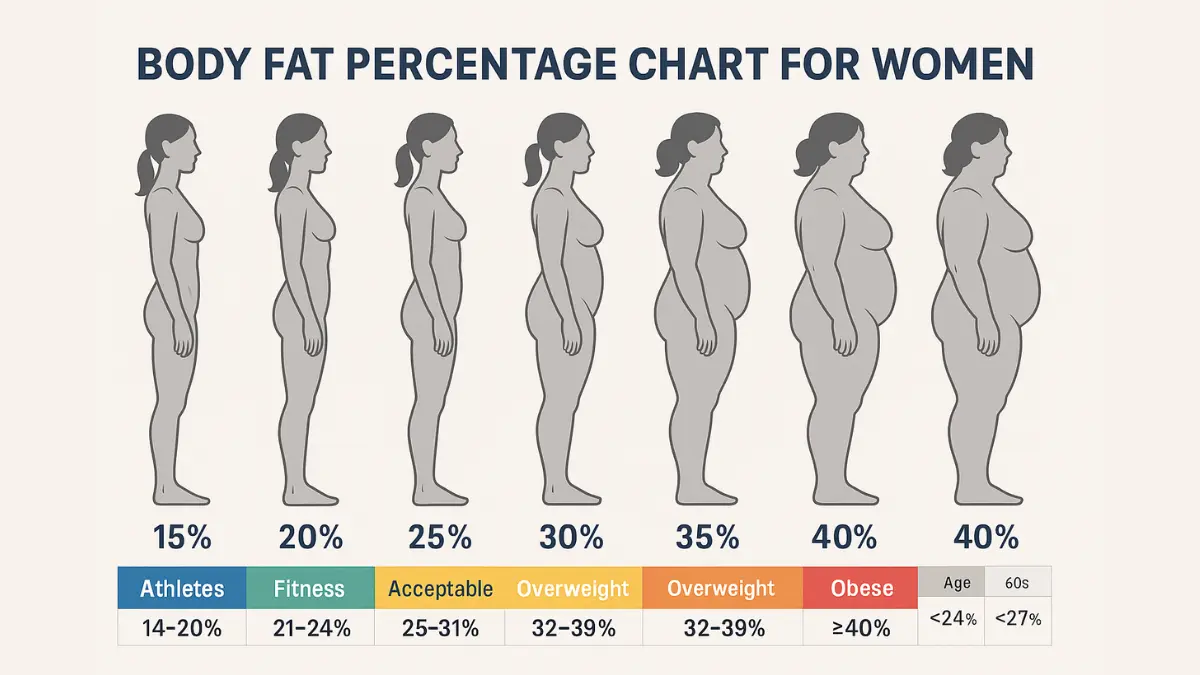
| Age Group | Essential Fat | Athletes | Fitness | Acceptable | Overweight | Obese |
|---|---|---|---|---|---|---|
| 20-29 | 10-13% | 14-20% | 21-24% | 25-31% | 32-39% | ≥40% |
| 30-39 | 10-14% | 15-21% | 22-25% | 26-32% | 33-40% | ≥41% |
| 40-49 | 11-15% | 16-22% | 23-26% | 27-33% | 34-41% | ≥42% |
| 50-59 | 12-16% | 17-23% | 24-27% | 28-34% | 35-42% | ≥43% |
| 60+ | 13-17% | 18-24% | 25-28% | 29-35% | 36-43% | ≥44% |
Source: American Council on Exercise, validated by Medical News Today and InBody medical research
What Each Women’s Category Means for Your Health
- Essential Fat (10-13%): Critical reproductive threshold. Body fat below 15% frequently causes amenorrhea (absent menstruation), infertility, bone mineral density loss, and hormonal disruption. Medical evaluation mandatory.
- Athletes (14-20%): Elite athletic range. However, lower end (14-16%) may disrupt menstrual cycles—athletic amenorrhea affects up to 44% of female athletes and signals energy deficiency requiring nutritional intervention. Monitor with physician.
- Fitness (21-24%): Optimal health zone. This range supports regular menstruation, healthy estrogen levels, excellent bone density, and lowest cardiovascular disease risk. Ideal for reproductive health and longevity.
- Acceptable (25-31%): Typical American female range. Body fat 25-27% remains metabolically healthy; approaching 30-31% shows early metabolic syndrome markers—particularly waist circumference >35 inches and fasting glucose 100-125 mg/dL.
Overweight (32-39%): Elevated risk category. According to MedlinePlus medical guidelines:
- Type 2 diabetes risk 1.6× baseline
- Breast cancer risk increases (adipose tissue produces estrogen post-menopause)
- PCOS symptoms worsen with hormonal imbalances
- Fertility challenges and pregnancy complications
- Medical action: Metabolic evaluation, structured weight management
Obese (≥40%): High-risk category requiring comprehensive medical intervention. Women face:
- 1.78× all-cause mortality (adjusted)
- 3.62× cardiovascular mortality
- Endometrial cancer risk increases 2-4× (excess estrogen)
- Severe PCOS with ovulatory dysfunction
- Critical threshold: Body fat ≥44% warrants pharmacotherapy or bariatric consultation per Cleveland Clinic protocols
Evidence-based hope: Even 5-7% body weight reduction (approximately 3-5% body fat decrease) significantly improves all metabolic markers, restores ovulation in many PCOS patients, and reduces cardiovascular risk by 20%.
Body Fat Percentage for Abs: The Visibility Truth
One of the most searched questions—“at what body fat percentage will I see abs?”—has a clear answer backed by physiology and genetics.
Men: Visible rectus abdominis typically appears at 10-12% body fat
Women: Abdominal definition typically appears at 16-19% body fat

Critical factors affecting visibility:
- Genetics dominate: Some individuals need 8-10% (men) or 14-16% (women) due to stubborn subcutaneous abdominal fat genetics
- Muscle development matters: Well-developed core musculature shows through higher body fat percentages
- Fat distribution patterns: “Apple” body shapes store more abdominal fat, requiring lower overall percentages for visibility
- Anterior vs lower abs: Upper abs appear first; lower abs require 1-3% lower body fat
Health reality check: Very low body fat isn’t necessary for optimal health. Men below 6% and women below 15% risk hormonal disruption, immune suppression, bone density loss, and chronic fatigue. Visible abs indicate low body fat but don’t guarantee superior health markers compared to slightly higher, sustainable percentages.
The Visceral Fat Factor: Location Trumps Total Percentage
Your waist-to-height ratio (calculated above) reveals the dangerous visceral fat surrounding internal organs—more predictive of cardiovascular disease than total body fat percentage alone.
Waist-to-Height Ratio Risk Categories
| Ratio | Risk Level | Health Implications |
|---|---|---|
| <0.5 | Healthy | Excellent visceral fat profile, lowest metabolic disease risk |
| 0.5-0.6 | Increased Risk | Moderate visceral accumulation, early insulin resistance |
| >0.6 | High Risk | Significant visceral adiposity, metabolic syndrome likely |
Target: Keep your waist circumference under half your height. The National Institute for Health and Care Excellence now prioritizes this metric over BMI for cardiovascular screening.
Why visceral fat is uniquely dangerous: Unlike subcutaneous fat that passively stores energy, visceral adipose tissue actively secretes inflammatory cytokines (TNF-α, IL-6), hormones (resistin), and fatty acids directly into portal circulation supplying the liver. This creates:
- Hepatic insulin resistance (liver ignores insulin signals → elevated blood glucose)
- Atherogenic dyslipidemia (small dense LDL particles, low HDL cholesterol)
- Endothelial dysfunction (impaired blood vessel dilation → high blood pressure)
- Prothrombotic state (increased blood clotting risk → heart attacks, strokes)
Research from the American Heart Association demonstrates each 2-inch waist increase = 10% higher heart disease risk—independent of total body fat percentage. A person at 22% body fat with waist-to-height ratio 0.62 faces greater cardiovascular danger than someone at 26% body fat with ratio 0.48.
Age-Adjusted Metabolic Risk Cut-Points
Recent NIH research established precise body fat thresholds where metabolic syndrome risk sharply increases:
Men:
- Age <40: Metabolic risk increases at ≥35.1% body fat
- Age ≥40: Metabolic risk increases at ≥34.8% body fat
Women:
- Age <40: Metabolic risk increases at ≥45.1% body fat
- Age ≥40: Metabolic risk increases at ≥46.3% body fat
Visceral fat mass thresholds:
- Men <40: >1.2 kg visceral fat = increased risk
- Men ≥40: >2.0 kg visceral fat = increased risk
- Women <40: >0.8 kg visceral fat = increased risk
- Women ≥40: >1.0 kg visceral fat = increased risk
These cut-points achieve 65-85% sensitivity and 60-85% specificity for detecting metabolic syndrome (≥3 criteria: large waist, high triglycerides, low HDL, elevated blood pressure, high fasting glucose).
When to Seek Medical Evaluation
Urgent professional assessment needed if:
- Body fat >35% men or >40% women with metabolic symptoms (excessive thirst, chronic fatigue, slow wound healing, frequent infections)
- Rapid unexplained fat gain (>5% in 3 months without dietary changes)
- Body fat <8% men or <15% women with menstrual changes, mood disturbances, persistent fatigue
- Waist circumference >40″ men or >35″ women plus 2+ risk factors (high blood pressure >130/85, triglycerides >150 mg/dL, HDL <40 men/<50 women, fasting glucose >100 mg/dL, family history cardiovascular disease)
- Any body fat percentage with concerning symptoms (chest pain, severe shortness of breath, uncontrolled blood sugar >200 mg/dL)
The National Institutes of Health recommends professional body composition testing (DEXA scan) as part of comprehensive metabolic evaluation, particularly when CDC obesity treatment guidelines suggest intervention warranted. Your healthcare provider can order complete metabolic panel, lipid profile, hemoglobin A1c (3-month glucose average), liver function tests, and cardiovascular risk assessment to develop evidence-based treatment plan.
Remember: Body fat percentage provides current status snapshot, but trends matter more than single measurements. Consistent progress toward healthier ranges—even 3-5% reduction—produces meaningful health benefits measurable in laboratory values, blood pressure normalization, medication reduction, and symptom improvement.
Health Risks & Evidence-Based Reduction Strategies
Understanding your body fat percentage means nothing without knowing the specific disease risks you face—and the proven strategies to optimize it. This section translates percentages into concrete health outcomes and provides the medical protocols that actually work.
The Cardiovascular Connection: Why Body Fat Percentage Matters More Than Weight
The landmark 2024 JAMA study analyzing 4,252 adults tracked for 15 years revealed a stunning truth: body fat percentage predicts mortality while BMI fails.
Critical findings:
- Adults with high body fat (≥27% men, ≥44% women) faced 1.78× increased all-cause mortality
- Same group showed 3.62× increased cardiovascular death risk
- High BMI showed no statistically significant mortality increase when adjusted for confounders
- Body fat percentage remained predictive independent of age, race, poverty level, or family history
What this means clinically: Two individuals at identical weight—one with 18% body fat (lean), one with 32% body fat (high adiposity)—face drastically different 15-year survival odds despite identical BMI classifications.
Disease Risk Cascade by Body Fat Level
Metabolic & Cardiovascular Diseases
Type 2 Diabetes:
- Body fat >25% men or >32% women: 1.5× baseline risk
- Mechanism: Excess adipose tissue (especially visceral) secretes inflammatory cytokines that induce insulin resistance—liver and muscles ignore insulin signals, causing chronic hyperglycemia
- Nearly 90% of individuals with body fat ≥30% men or ≥40% women develop type 2 diabetes
Cardiovascular Disease:
- High body fat increases blood pressure, LDL cholesterol, triglycerides while decreasing protective HDL cholesterol
- Visceral fat particularly dangerous—each 2-inch waist increase = 10% higher heart disease risk
- Research shows body fat percentage correlates with triglycerides, total cholesterol, LDL, and fasting glucose—while BMI shows no correlation with these critical markers
Fatty Liver Disease (NAFLD):
- Present in 60-70% of individuals with body fat 25-29% men
- Progresses to nonalcoholic steatohepatitis (NASH) and cirrhosis if untreated
- Mechanism: Excess fat accumulates in liver cells, triggering inflammation and scarring
Cancer Risk
Higher body fat percentages associate with 13 cancer types, particularly:
- Postmenopausal breast cancer (adipose tissue produces estrogen)
- Endometrial cancer (2-4× risk increase from estrogen dominance)
- Colorectal cancer
- Kidney, liver, pancreatic, esophageal cancers
- Thyroid, gallbladder, ovarian cancers
- Multiple myeloma, meningioma
Mechanism: Chronic inflammation from cytokine secretion, hormonal imbalances (elevated estrogen, insulin, IGF-1), and impaired immune surveillance allow cancer cells to proliferate unchecked.
Musculoskeletal & Reproductive Health
Osteoarthritis: Excess body fat—not just weight—accelerates joint degeneration through mechanical stress plus inflammatory cytokines degrading cartilage
Women’s reproductive health:
- Body fat >35% worsens PCOS symptoms (irregular ovulation, hirsutism, infertility)
- Pregnancy complications increase: gestational diabetes, preeclampsia, cesarean delivery
- Body fat <15% disrupts menstruation and fertility through inadequate estrogen production
Evidence-Based Fat Reduction: What Medical Research Proves
The National Institutes of Health evidence review analyzing decades of weight loss studies established clear protocols—we’ll focus exclusively on Evidence Category A recommendations.
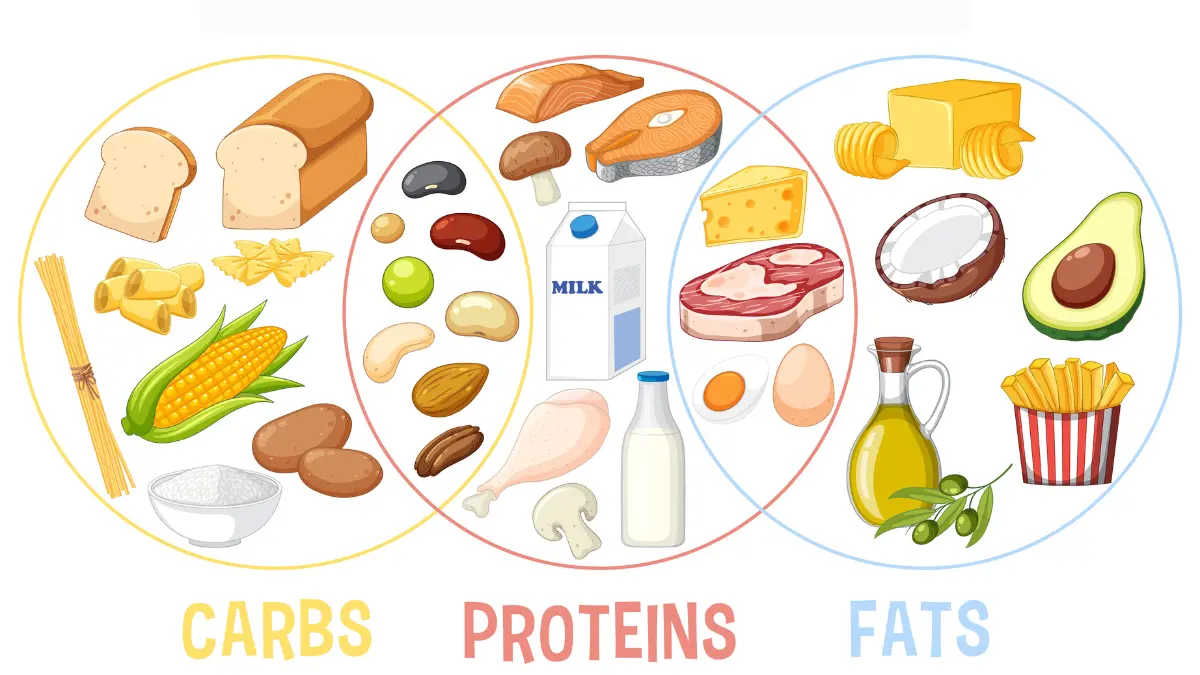
Nutrition: The 70% Factor
Caloric Deficit (Non-Negotiable Foundation):
- Create 500-750 calorie daily deficit for sustainable 1-2 lb weekly loss
- Use your TDEE calculated above to establish baseline
- Minimum intake: 1,200 kcal women, 1,500 kcal men (prevents metabolic shutdown)
- Evidence: Average 8% body weight loss over 3-12 months with structured low-calorie diets
Macronutrient Targets for Muscle Preservation:
| Macro | Target | Why It’s Critical |
|---|---|---|
| Protein | 1.6-2.2 g/kg body weight | Spares 0.5-1 kg more muscle per 5 kg lost; highest thermic effect (25-30% calories burned digesting) |
| Fat | 20-35% calories | Essential for hormone production (testosterone, estrogen), vitamin absorption |
| Carbs | Remaining calories | Fuels exercise performance; prefer low-glycemic, high-fiber sources |
- Protein distribution: Consume 25-30g per meal for optimal muscle protein synthesis—studies show this pattern preserves significantly more lean mass during deficit than same daily total consumed unevenly.
- Fiber target: 25-35g daily from vegetables, legumes, whole grains, fruits. Research shows high-fiber diets increase satiety hormones (GLP-1, PYY) by 20%, stabilize blood glucose fluctuations, and improve gut microbiome diversity—all critical for sustainable fat loss.
- Hydration protocol: 0.5-1 oz per pound body weight. Controlled trials demonstrate drinking 500ml water before meals increases weight loss by 44% over 12 weeks through enhanced satiety and temporary metabolic boost (100 calories over 90 minutes).
Exercise: The Metabolic Catalyst
Resistance Training (Priority #1):
The Physical Activity Guidelines for Americans recommend 2+ sessions weekly targeting all major muscle groups—but fat loss optimization requires more.
Optimal protocol:
- Frequency: 3-4 days weekly (full-body or upper/lower split)
- Volume: 10-20 sets per muscle group weekly
- Progressive overload: Gradually increase weight 2-5% when you can complete target reps
- Compound movements priority: Squats, deadlifts, presses, rows (recruit most muscle mass)
Why resistance training is non-negotiable:
- Prevents muscle loss during caloric deficit (preserves metabolic rate)
- Each pound of muscle burns 6-10 calories daily at rest
- Creates EPOC (excess post-exercise oxygen consumption)—metabolism remains elevated 100-200 calories for 24-48 hours post-workout
- Improves insulin sensitivity and glucose disposal independent of fat loss
Cardiovascular Exercise (The Fat-Burning Accelerator):
- Minimum effective dose: 150-300 min/week moderate intensity OR 75-150 min/week vigorous intensity
- Zone 2 cardio (60-70% max heart rate): Optimizes fat oxidation as primary fuel source—sustainable for longer duration, accumulates significant caloric expenditure. Activities: brisk walking, easy cycling, swimming.
- HIIT protocols (High-Intensity Interval Training): 20-30 minute sessions alternating 30-60 seconds maximum effort with 1-2 minutes recovery. Evidence shows HIIT reduces visceral fat more effectively than steady-state cardio while preserving muscle mass and requiring less time.
- NEAT Optimization (Non-Exercise Activity Thermogenesis): Accounts for 15-30% of daily energy expenditure—more than structured exercise for sedentary individuals. Target 7,000-10,000 daily steps (burns 200-400 calories), take stairs, use standing desk, walk during calls.
Lifestyle Factors: The Hidden Variables
Sleep: Your Fat-Loss Secret Weapon (Target: 7-9 hours):
Sleep deprivation sabotages fat loss through multiple mechanisms:
- Increases ghrelin (hunger hormone) by 15%
- Decreases leptin (satiety hormone) by 15%
- Elevates cortisol (promotes visceral fat storage)
- Critical research: Sleep-deprived dieters lose 55% less fat and 60% more muscle compared to well-rested dieters at identical caloric deficits
Sleep hygiene protocol: Consistent bed/wake times (weekends included), room temperature 60-67°F, complete darkness, no screens 60 minutes pre-bed, limit caffeine after 2 PM.
Stress Management (Cortisol Control):
Chronic stress elevates cortisol, triggering preferential visceral fat accumulation—the most metabolically dangerous depot. Research shows high-stress individuals have 3-4 cm greater waist circumference independent of total body fat.
Evidence-based interventions:
- Meditation: 20-minute daily practice reduces cortisol 20%
- Yoga/tai chi: Combines movement with stress reduction
- Nature exposure: “Forest bathing” decreases stress hormones measurably
- Social connection: Strong relationships buffer cortisol response
- Professional counseling for chronic stress/anxiety
Alcohol Consideration:
Alcohol provides 7 calories/gram with zero nutritional value—nearly as caloric as fat (9 cal/g). Additionally, alcohol metabolism prioritizes ethanol clearance, halting fat oxidation for 12-36 hours post-consumption.
Recommendation per American Heart Association: Limit to 1 drink daily (women) or 2 daily (men) if weight loss is goal. Better yet, eliminate entirely during active fat-loss phases—studies show abstainers lose 20-30% more fat than moderate drinkers at identical caloric deficits.
Medical Interventions When Lifestyle Isn’t Enough
FDA-Approved Pharmacotherapy:
Consider when: BMI ≥30 or ≥27 with weight-related comorbidities (diabetes, hypertension, sleep apnea), plus 6 months failed lifestyle modification
Current evidence-based options:
- GLP-1 receptor agonists (semaglutide/Wegovy, liraglutide/Saxenda): 10-15% body weight loss, improve glycemic control and cardiovascular markers
- Combination therapies (phentermine-topiramate/Qsymia, naltrexone-bupropion/Contrave): 5-10% weight loss
Requirement: Ongoing medical supervision, combination with continued lifestyle program for best outcomes and maintenance.
Bariatric Surgery:
Candidate criteria: BMI ≥40 or ≥35 with serious comorbidities (type 2 diabetes requiring medication, severe sleep apnea, cardiovascular disease)
Evidence: 25-30% total body weight loss sustained at 5 years, diabetes remission in 60-80% of cases, significant reduction in all-cause mortality and cardiovascular events.
Procedures: Gastric bypass (Roux-en-Y), sleeve gastrectomy, adjustable gastric band—each with distinct mechanisms requiring comprehensive bariatric team evaluation.
Realistic Timelines & Expectations
Safe Fat Loss Rate: 0.5-1% body weight weekly (1-2 lbs for most adults). Faster loss sacrifices muscle and triggers metabolic adaptation—your body defensively slows metabolism to preserve energy stores.
Example calculation: 180 lb person at 30% body fat wanting to reach 20%:
- Current fat mass: 54 lbs
- Target fat mass: 36 lbs
- Fat to lose: 18 lbs
- Timeline: 12-24 weeks at sustainable pace
Plateaus Are Normal: After 10-15% weight loss, metabolic adaptation occurs—hormonal shifts (leptin decline, thyroid hormone reduction, cortisol elevation) mean you require fewer calories than calculations predict.
Plateau-breaking strategies:
- Recalculate TDEE with new body weight (may need 200-300 fewer calories)
- Take 1-2 week diet break at maintenance calories (resets leptin, reduces stress)
- Increase NEAT and daily steps
- Reassess portions (portion creep common after weeks of tracking)
Long-Term Maintenance Reality: Statistics show 80% of weight loss is regained within 5 years—but successful maintainers share specific behaviors: continued self-monitoring (food/weight tracking), high physical activity (60-90 min daily), regular breakfast consumption, limited screen time, building sustainable habits versus temporary diets.
Maintenance metabolism: Expect to require 200-300 calories fewer than metabolic equations predict due to adaptive thermogenesis—your new normal requiring permanent lifestyle adjustment, not temporary change.
Evidence-based hope: Even 5-7% body weight reduction (approximately 3-5% body fat decrease) significantly improves cardiovascular risk markers, blood sugar control, inflammatory status, and medication requirements—meaningful health benefits don’t require reaching “ideal” percentages. Sustainable progress beats perfection every time.
Frequently Asked Questions (Expert Answers)
1. Can you have a healthy BMI but unhealthy body fat percentage?
Yes, this “normal weight obesity” phenomenon affects 30% of normal-BMI adults who face metabolic syndrome risks identical to clinically obese individuals. Two people at identical BMI can have drastically different health profiles—one muscular with 15% body fat, another sedentary with 32% body fat. Body fat percentage predicts mortality 1.78× more accurately than BMI.
2. How quickly can I safely reduce body fat percentage?
Safe sustainable rate: 0.5-1% body fat per month (roughly 1-2 lbs weekly for most people). Faster loss sacrifices muscle alongside fat, damaging metabolism. Expect 6-12 months to reduce from 28% to 22% body fat. The NIH confirms gradual loss preserves lean mass and produces sustainable results versus crash dieting.
3. Does spot reduction work for belly fat?
No. Decades of research confirm you cannot target fat loss to specific areas through localized exercise. Fat reduces systemically based on genetics and hormones. However, resistance training builds muscle underneath fat—as overall body fat decreases through caloric deficit and cardio, developed muscles become visible. Waist-to-height ratio tracks visceral belly fat progress.
4. What’s more important: reducing body fat or increasing muscle?
Both work synergistically. Higher muscle mass increases metabolic rate by 6-10 calories per pound daily, making fat loss easier to maintain. Simultaneously, reducing excess visceral fat improves insulin sensitivity and lowers cardiovascular risk. Focus on body recomposition: high protein (1.6-2.2g/kg), resistance training 3-4× weekly, modest deficit (250-500 calories).
5. Do body fat scales work accurately?
Consumer BIA scales have ±21-34% error—insufficient for absolute accuracy. Professional devices (InBody) offer improved ±3-5% error when calibrated. Use home scales only for trend tracking over weeks (same time/day, fasted state). For baseline precision, the US Navy method (calculator above) or DEXA scan ($50-150) provide superior accuracy.
6. At what body fat percentage will I see abs?
Men: Typically 10-12% body fat for visible rectus abdominis
Women: Typically 16-19% body fat for abdominal definition
Genetics significantly influence visibility—some need 8-10% (men) or 14-16% (women) due to fat distribution patterns. Very low body fat (<6% men, <15% women) isn’t necessary for health and risks hormonal disruption.
7. Is it harder to lose body fat as you age?
Yes—metabolism declines 1-2% per decade after age 30 due to muscle loss (sarcopenia of 3-8% per decade without intervention). Hormonal changes compound this: testosterone declines 1% annually in men, menopause drastically reduces estrogen in women. However, resistance training and adequate protein (1.2-1.6g/kg) preserve muscle and metabolic function at any age.
8. Can I trust body fat percentages from gym InBody machines?
Professional BIA devices like InBody are more accurate than home scales (±3-4% vs ±21-34% error) when used under standardized conditions. Maximize accuracy: same machine/time, fasted state (12+ hours), no exercise 12+ hours prior, normal hydration. Use for relative changes (tracking progress) rather than absolute precision.
9. What body fat percentage is too low for women’s health?
Below 15% body fat, many women experience menstrual irregularities, hormonal disruption, bone density loss, and infertility. Essential fat for women (10-13%) supports reproductive function. Athletic amenorrhea affects up to 44% of female athletes at 14-16% body fat—requires medical intervention, increased calories, or reduced training intensity.
10. How does body fat affect hormones?
Body fat >25% men or >32% women increases aromatase enzyme, converting testosterone to estrogen and causing imbalances. Each 5% body fat increase reduces testosterone 2-4% in men. Very low body fat (<15% women) disrupts estrogen production, causing amenorrhea and fertility issues. Optimizing to healthy ranges often normalizes hormones without medication.
11. How accurate is the US Navy body fat method?
The Navy circumference method delivers ±3-4% accuracy—validated against hydrostatic weighing in studies of thousands of military personnel. Correlation coefficients reach 0.84-0.92 with standard error of estimate 3-4%—matching or exceeding consumer BIA devices costing hundreds of dollars. Sufficient for health risk assessment and progress tracking.
12. What’s a dangerous waist-to-height ratio?
Target: waist under half your height (ratio <0.5). Ratios 0.5-0.6 indicate increased risk; >0.6 signals high cardiovascular risk requiring medical evaluation. NICE guidelines now prioritize this metric over BMI for cardiovascular screening because it reveals dangerous visceral fat accumulation—each 2-inch waist increase = 10% higher heart disease risk.
13. How much body fat can I lose per month?
Safe maximum: 1% body fat monthly for most adults, or 0.5-1% body weight weekly. Example: 180 lb person losing 1.5 lbs weekly loses roughly 1% body fat monthly. Faster loss indicates excessive muscle loss alongside fat—counterproductive for long-term metabolism. Expect 3-10 months to reduce body fat by 10%.
14. Can I lose fat and gain muscle simultaneously?
Yes—body recomposition is possible for beginners, returning athletes, and those with elevated body fat (>25% men, >32% women). Strategy: smaller deficit (250-500 cal/day), very high protein (2-2.4g/kg), progressive resistance training 4-5× weekly. Beginners can gain 2-3 lbs muscle while losing 6-8 lbs fat over first 12-16 weeks.
15. What causes body fat plateaus?
After 10-15% weight loss, metabolic adaptation occurs—hormonal shifts (leptin decline, thyroid reduction, cortisol elevation) mean you require 200-300 fewer calories than calculations predict. Solutions: recalculate TDEE with new weight, take 1-2 week diet break at maintenance (resets leptin), increase NEAT/steps, reassess portions for tracking accuracy.
16. How does sleep affect body fat loss?
Sleep deprivation sabotages fat loss dramatically: increases ghrelin (hunger) 15%, decreases leptin (satiety) 15%, elevates cortisol. Critical research shows sleep-deprived dieters lose 55% less fat and 60% more muscle than well-rested dieters at identical deficits. Target 7-9 hours nightly with consistent schedule, cool room (60-67°F), complete darkness.
17. What body fat percentage do athletes maintain?
Elite athletes maintain sport-specific ranges:
Endurance athletes: 6-13% men, 14-20% women
Strength/power athletes: 10-15% men, 18-22% women
Off-season maintenance: 12-17% men, 20-25% women
Very low body fat (<6% men, <14% women) is sustainable only short-term for competition—requires medical monitoring for hormones, bone density, immune function.
18. Should I focus on weight loss or body fat percentage?
Body fat percentage is superior for assessing health and progress. Scale weight includes water, muscle, bone, organs—you can lose 10 lbs but gain body fat if it’s mostly muscle loss. Track body fat percentage, waist circumference, and body measurements alongside weight for complete picture. Even maintaining weight while reducing body fat 5% produces significant health improvements.
19. How long does it take to reduce body fat from 25% to 15%?
For sustainable results: 3-10 months depending on starting weight and adherence. Safe reduction of 1% body fat monthly means 10% reduction requires 10 months. Example: 180 lb person at 25% body fat (45 lbs fat) targeting 15% (27 lbs fat) needs to lose 18 lbs fat—achievable in 12-24 weeks with proper nutrition, resistance training, and cardio protocol.
20. Do certain foods burn fat faster?
No foods “burn fat”—weight loss requires caloric deficit regardless of food choices. However, certain foods support fat loss: high-protein foods (increase thermic effect 25-30%, preserve muscle), high-fiber foods (increase satiety hormones 20%, stabilize blood glucose), water (drinking 500ml before meals increases weight loss 44% over 12 weeks). Avoid “fat-burning supplements”—most lack evidence and FDA approval.
Your Complete Health & Fitness Resource Center
More Free Health Calculators
Take control of your health with our complete suite of medical-grade calculators:
Body Composition & Weight Management
- BMI Calculator – Calculate your Body Mass Index and understand how it compares to your body fat percentage for a complete health picture
- Body Fat Calculator (you’re here) – Measure your body composition with medical-grade accuracy
Expert Health Articles & Guides
Our medical advisory team publishes evidence-based content to help you achieve your health goals:
Next Steps Based on Your Results
If your body fat percentage is higher than desired:
- Read “Your Goal Fat Loss Guide” (link to relevant article if exists)
- Calculate your calorie deficit using our TDEE Calculator
- Review our “Nutrition for Fat Loss” article series
- Download our free meal planning template (if you have this)
If you’re at a healthy body fat level:
- Learn how to maintain your results long-term
- Explore body recomposition strategies (lose fat + gain muscle)
- Optimize your training with our fitness calculators
- Read about metabolic health optimization
If you have concerning results (very high or very low body fat):
- Review “When to See a Doctor About Body Composition” (link if exists)
- Print your results to discuss with your healthcare provider
- Explore our articles on medical weight management options
- Learn about metabolic syndrome and cardiovascular risk factors
Stay Updated with Expert Health Guidance
Visit Our Health Blog → for weekly articles reviewed by our medical advisory panel of 21+ board-certified physicians, registered dietitians, and certified fitness specialists.
Topics we cover:
- Latest research in nutrition and exercise science
- Evidence-based weight loss strategies
- Metabolic disease prevention and management
- Fitness programming for all experience levels
- Supplement science and recommendations
- Healthy aging and longevity optimization
All content is:
✓ Reviewed by licensed medical professionals
✓ Based on peer-reviewed research
✓ Updated regularly with latest science
✓ Written for practical application
✓ Free from commercial bias
Image credits: Designed by Freepik
About this content
How this article was put together: researched from recognised health sources, drafted with the help of AI tools, and edited by hand, with sources linked throughout.

Sameer Patel is the founder and editor of My Medicine Advisor. He is not a doctor or medical professional — before starting this site he worked in banking,…
Medical disclaimer
The content on MyMedicineAdvisor is provided for general informational and educational purposes only and is not a substitute for professional medical advice, diagnosis, or treatment. Health information on this website should not be used to diagnose, treat, cure, or prevent any condition without guidance from a qualified healthcare professional. Always seek the advice of your doctor, physician, or another licensed healthcare provider with any questions you may have regarding a medical condition, symptoms, medications, or treatment decisions.