On This Page – Quick Medical Summary
What Your Echocardiogram Results Really Tell You About Your Heart
Echocardiogram results reveal how well your heart pumps blood, whether your valves function properly, and if your heart chambers are the right size and thickness according to NIH clinical guidelines. These findings help doctors diagnose conditions ranging from heart failure to valve disease, providing a complete picture of your cardiovascular health through a painless ultrasound examination.
When Fear Meets Clarity: Sarah’s Story
Sarah Martinez, 54, sat in her car clutching a manila envelope containing her echocardiogram results. Her primary care doctor had ordered the test after she mentioned persistent shortness of breath during her morning walks. The report was filled with terms like “ejection fraction,” “mild mitral regurgitation,” and “left ventricular function”—medical jargon that sent her anxiety spiraling.
“I Googled every word and convinced myself I was dying,” Sarah recalls. “But when I sat down with my cardiologist, she translated everything into language I could understand. My ejection fraction was 58%—perfectly normal. The ‘mild’ valve issue required monitoring, not surgery. Suddenly, understanding echocardiogram results transformed my fear into a manageable action plan.”
Sarah’s experience mirrors that of millions who receive echocardiogram results without immediate context, as documented in patient communication research published by the National Institutes of Health. The gap between receiving medical data and comprehending its implications can trigger unnecessary stress, particularly when abnormal echocardiogram results appear on paper before a physician explains their significance.
What This Means For You: Immediate Action Steps
If you’ve just received your echocardiogram results, here’s what to do right now:
- Don’t panic over medical terminology – Terms like “trace regurgitation” often indicate minor, clinically insignificant findings that don’t require treatment according to American Heart Association echo standards.
- Note your ejection fraction number – This single measurement (normal range: 55-70%) tells you how much blood your heart pumps with each beat based on University of Rochester Medical Center ejection fraction guidelines.
- Check for the words “normal” or “within normal limits” – These phrases indicate healthy heart function across multiple parameters.
- Use a symptom checker to document any cardiovascular symptoms you’re experiencing, which helps your doctor correlate findings with your daily experiences.
- Schedule a follow-up – Results require professional interpretation, especially if abnormal echocardiogram results are present.
- Track your cardiovascular health between appointments using a heart rate zone calculator to monitor exercise tolerance and recovery patterns.
Core Components Your Echocardiogram Results Measure
Understanding echocardiogram results requires knowing what the test actually evaluates according to NCBI cardiology textbooks. This non-invasive cardiac ultrasound, performed by trained sonographers and interpreted by cardiologists, assesses four critical heart functions:
Pumping strength (ejection fraction): The percentage of blood your left ventricle ejects with each contraction. Normal echocardiogram results show an ejection fraction normal range between 55-70%, indicating efficient cardiac output as defined by the American Heart Association’s heart failure measurement standards. Values below 40% suggest weakened pumping ability that may indicate heart failure, while extremely high numbers (above 75%) can signal hypertrophic conditions.
Valve function: Your echocardiogram evaluates all four heart valves—mitral, aortic, tricuspid, and pulmonary—for proper opening and closing. Abnormal echocardiogram results might reveal regurgitation (backward leaking) or stenosis (narrowing), with severity graded from trace to severe based on blood flow measurements.
Chamber size and wall thickness: Enlarged chambers or thickened walls can indicate chronic high blood pressure, valve disease, or cardiomyopathy. Normal echocardiogram results show appropriately sized chambers relative to body size and age.
Blood flow patterns: Doppler technology within the echo reveals how blood moves through your heart and vessels, detecting abnormal pressures or flow restrictions. These measurements help identify pulmonary hypertension, shunts between chambers, and other circulatory issues.
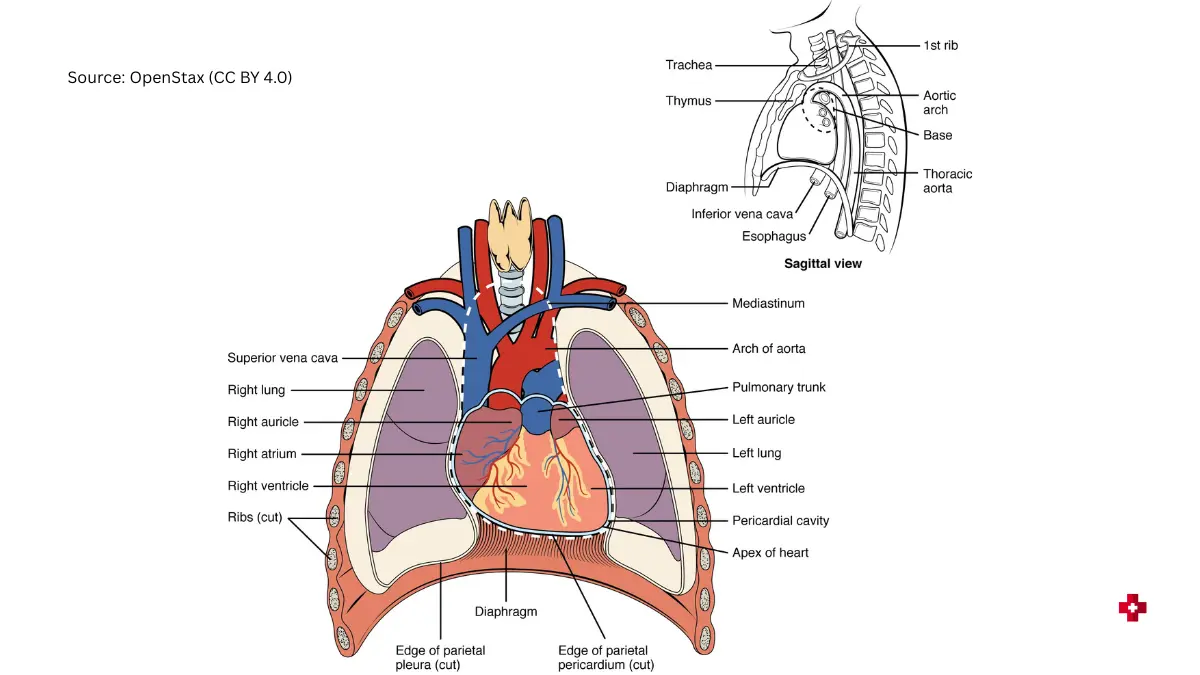
Adapted from OpenStax Heart Anatomy, licensed under CC BY 4.0.
Why Understanding Your Results Empowers Better Health Outcomes
Interpreting echocardiogram results correctly transforms abstract medical data into actionable health information. Research published in the National Library of Medicine database shows that patients who understand their cardiac test results demonstrate better medication adherence, make more informed lifestyle modifications, and experience reduced anxiety about their cardiovascular health.
When you comprehend what does my echocardiogram show, you become an active participant in your care rather than a passive recipient of medical services. This knowledge enables meaningful conversations with your healthcare team, helps you recognize when symptoms warrant urgent attention, and supports long-term cardiovascular disease prevention strategies that extend far beyond the echo lab.
Disclaimer: This article is for educational purposes and not a substitute for professional medical advice. Always consult your cardiologist to interpret your specific echocardiogram results.
Decoding Your Echocardiogram Report – Key Measurements Explained
Ejection Fraction: The Most Important Number
The ejection fraction meaning represents the percentage of blood your left ventricle pumps out with each heartbeat, making it the single most critical measurement in echocardiogram results. When cardiologists review your report, they look at this number first because it directly indicates your heart’s pumping strength and overall function.
Understanding ejection fraction normal range requires knowing the standard benchmarks established by the American Heart Association’s heart failure measurement protocols. A healthy heart ejects between 55-70% of its blood volume with each contraction, though some medical centers use 50-70% as the normal reference based on University of Rochester Medical Center cardiology guidelines. This variation reflects different measurement techniques and patient populations studied internationally.
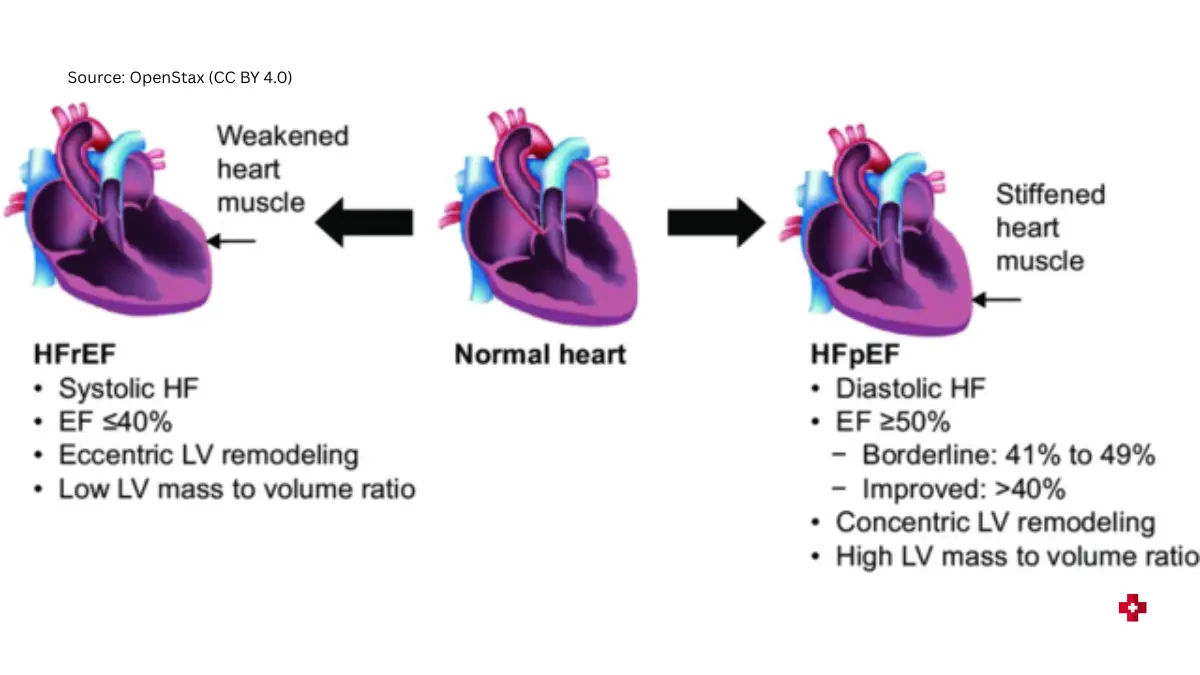
Adapted from Wikipedia Commons, licensed under CC BY 4.0.
Low ejection fraction meaning signals that your heart muscle has weakened and cannot pump efficiently. When echocardiogram results explained show an EF below 40%, cardiologists diagnose heart failure with reduced ejection fraction (HFrEF), which requires immediate medical intervention. The severity classification breaks down as follows:
| Ejection Fraction Range | Classification | What It Means for You | Typical Next Steps |
|---|---|---|---|
| 55-70% | Normal | Heart pumps efficiently | Routine wellness monitoring |
| 41-54% | Mildly reduced (HFmrEF) | Early dysfunction detected | Lifestyle changes, possible medications |
| 30-40% | Moderately reduced | Significant pumping weakness | Cardiology referral, treatment plan |
| Below 30% | Severely reduced | Critical heart failure range | Urgent specialist care, device therapy consideration |
Heart failure on echocardiogram doesn’t always mean severely reduced ejection fraction. Approximately half of heart failure patients have preserved ejection fraction (HFpEF), where the EF appears normal but the heart muscle is stiff and doesn’t relax properly between beats. This diastolic dysfunction requires different treatment approaches than systolic heart failure.
What This Means For You: When Ejection Fraction Changes Require Action
If your echocardiogram results show an EF drop of 10% or more since your last test, contact your cardiologist within one week even if you feel fine. Declining EF can precede symptoms by months. Patients with diabetes should track their blood sugar levels closely since uncontrolled glucose damages heart muscle and progressively reduces ejection fraction over time.
Heart Valve Function Results
Interpreting echocardiogram results for valve function requires understanding both regurgitation (backward leaking) and stenosis (narrowing). Your echo uses color Doppler imaging to visualize blood flow through all four heart valves—mitral, aortic, tricuspid, and pulmonary—detecting even minor abnormalities invisible on standard ultrasound.
Mitral valve regurgitation echo findings are graded on a severity scale according to NIH valve assessment protocols. “Trace” or “trivial” regurgitation appears in up to 70% of healthy adults and requires no treatment. Mild regurgitation typically needs monitoring every 2-3 years, while moderate to severe cases demand closer surveillance and potential surgical intervention based on symptoms and heart chamber enlargement.

Aortic stenosis echocardiogram measurements focus on valve area and pressure gradient across the narrowed opening. Normal aortic valve area measures 3.0-4.0 cm², but severe stenosis reduces this to less than 1.0 cm². The mean pressure gradient—the force difference between the left ventricle and aorta—helps determine surgical timing, with gradients above 40 mmHg indicating severe disease requiring valve replacement consideration.
| Valve Problem | Echo Finding | Severity Markers | Symptoms to Watch For |
|---|---|---|---|
| Mitral Regurgitation | Backward blood flow into left atrium | Jet width, regurgitant volume, EROA* | Shortness of breath, fatigue, leg swelling |
| Aortic Stenosis | Narrowed valve opening | Valve area <1.0 cm², gradient >40 mmHg | Chest pain, dizziness, fainting during exertion |
| Tricuspid Regurgitation | Leaky valve between chambers | Jet area ratio to atrium size | Abdominal bloating, liver congestion |
| Aortic Regurgitation | Backward leak into left ventricle | Jet width, pressure half-time | Bounding pulse, chest discomfort |
*EROA = Effective Regurgitant Orifice Area
Tricuspid regurgitation often goes unnoticed until moderate or severe stages develop. Echocardiogram findings explained in the report might mention “physiologic TR” (trace tricuspid regurgitation), which is completely normal and found in most healthy people. However, worsening TR can indicate right heart failure or pulmonary hypertension requiring specialized treatment.
Left Ventricular Function Results
Left ventricular function results extend beyond ejection fraction to include wall motion analysis and chamber dimensions. Cardiologists divide the left ventricle into 17 segments, scoring each area’s contraction on a scale from 1 (normal) to 4 (aneurysmal). Regional wall motion abnormalities often indicate previous heart attacks, with affected segments contracting poorly or not at all.
Chamber size measurements reveal chronic stress on your heart. Left ventricular internal diameter (LVID) should measure 3.9-5.3 cm in women and 4.2-5.9 cm in men at end-diastole. Enlargement beyond these ranges suggests volume overload from valve disease or long-standing high blood pressure, particularly in patients with elevated BMI who face increased cardiovascular demands.
Diastolic dysfunction—impaired relaxation between heartbeats—appears on echocardiogram results through specific Doppler patterns of blood flow across the mitral valve. The E/A ratio (early to late filling) and E/e’ ratio help grade diastolic dysfunction from Grade I (mild impairment) to Grade III (restrictive pattern), with higher grades indicating stiffer heart muscle and worse prognosis.
Normal vs Abnormal Echocardiogram Results – A Complete Comparison
What Normal Echocardiogram Results Look Like
Normal echocardiogram results display a coordinated, efficient heart with properly functioning valves, appropriate chamber sizes, and strong pumping ability. When cardiologists review your report and state everything appears “within normal limits,” they’re confirming that multiple measurements fall within established reference ranges validated by the National Institutes of Health normal echocardiography database.
A complete normal echocardiogram results checklist includes:
- Normal ejection fraction (55-70%) – Your left ventricle pumps more than half its blood volume with each beat
- Intact valve function – All four valves open fully and close completely without regurgitation or stenosis beyond trace amounts
- Appropriate chamber sizes – Left ventricular diameter measures 3.9-5.3 cm (women) or 4.2-5.9 cm (men), with proportional atrial and right heart dimensions
- Normal wall thickness – Interventricular septum and posterior wall measure 0.6-1.0 cm, not thickened or thinned
- Regular blood flow patterns – Doppler shows laminar flow without turbulence, proper filling velocities, and no shunts between chambers
- No fluid collections – Pericardial space contains minimal physiologic fluid (less than 50 mL) without effusion
Normal echocardiogram results also confirm your heart’s size matches your body dimensions. Cardiologists index chamber measurements to body surface area, which accounts for variations related to height and weight calculated through your ideal weight parameters. Athletes and individuals with larger body frames naturally have bigger hearts that would appear abnormal if judged by standard cutoffs alone.
Patient Perspective: The Relief of Normal Results
Marcus Chen, 62, underwent echocardiography after experiencing chest tightness during yard work. “When my doctor called to say my echocardiogram results were completely normal, I could finally breathe,” he recalls. His symptoms stemmed from acid reflux, not cardiac disease. The normal echo provided definitive reassurance that his heart structure and function remained excellent despite his family history of cardiovascular disease.
Understanding Abnormal Echocardiogram Results
Abnormal echocardiogram results don’t automatically indicate life-threatening disease. Many findings represent mild variations that require monitoring rather than immediate intervention, though understanding the severity helps determine appropriate next steps.
Echocardiogram findings explained typically fall into four abnormal categories:
Structural abnormalities include valve defects (bicuspid aortic valve, mitral valve prolapse), septal defects (holes between chambers), intracardiac masses (tumors, clots, vegetations from infection), and congenital malformations detected in adulthood.
Functional problems encompass reduced ejection fraction below 55%, diastolic dysfunction (stiff heart muscle), wall motion abnormalities indicating previous myocardial infarction damage, and asynchronous contraction patterns.
Size abnormalities reveal enlarged chambers from chronic volume overload or high blood pressure, thickened walls from hypertrophic cardiomyopathy or poorly controlled hypertension, and atrial enlargement predisposing to arrhythmias like atrial fibrillation.
Flow abnormalities demonstrate valve regurgitation (backward leaking), valve stenosis (narrowed openings), shunts between chambers, elevated pulmonary artery pressures, and abnormal patterns suggesting restrictive or constrictive processes.
| Finding | Mild Severity | Moderate Severity | Severe Severity | When Immediate Action Required |
|---|---|---|---|---|
| Valve Regurgitation | Trace to mild leak | Moderate volume | Large regurgitant volume | Severe with symptoms = 1-2 weeks |
| LV Dysfunction | EF 41-54% | EF 31-40% | EF below 30% | EF <40% requires treatment plan |
| Chamber Enlargement | 1-2 cm above normal | 2-3 cm enlarged | >3 cm significantly enlarged | Severe + symptoms = immediate |
| Pericardial Effusion | Small (<1 cm) | Moderate (1-2 cm) | Large (>2 cm) | Any size with tamponade signs |
Pericardial effusion—fluid accumulation around the heart—appears on abnormal echocardiogram results as an echo-free space between pericardial layers, with clinical significance determined by quantity and whether it compresses cardiac chambers according to University of Texas pericardial assessment protocols.
When to Worry About Your Results
Echo test results interpretation requires distinguishing findings that need urgent attention from those warranting watchful monitoring. Understanding echocardiogram results means knowing which abnormalities demand immediate action versus scheduled follow-up.
Red flag findings requiring urgent cardiology consultation within 24-48 hours include:
- Ejection fraction below 35% with new onset
- Severe valve stenosis or regurgitation not previously documented
- Large pericardial effusion with tamponade signs (chamber collapse, respiratory flow variation)
- New wall motion abnormalities suggesting recent heart attack
- Intracardiac mass or vegetation suggesting infection
- Significantly elevated pulmonary artery pressures
Findings needing monitoring but not emergencies encompass mild to moderate valve regurgitation without symptoms, borderline ejection fraction (45-54%), mild chamber enlargement, trace pericardial effusion, and incidental patent foramen ovale (small atrial communication present in 25% of adults).
Incidental findings usually benign include trace tricuspid regurgitation (physiologic in most people), mildly prominent Chiari network (normal anatomic variant), small lipomatous atrial septal hypertrophy, and mild spontaneous echo contrast without clots.
What This Means For You: Your Action Timeline
Interpreting echocardiogram results with your physician creates a personalized action plan. If abnormal echocardiogram results show severe findings, expect cardiology referral within one week. Moderate abnormalities typically warrant specialist evaluation within 2-4 weeks, while mild findings might involve repeat echocardiography in 6-12 months to assess progression.
Patients should recognize warning signs documented by MedlinePlus that indicate their cardiac status is worsening: new or worsening shortness of breath, chest pain, fainting episodes, extreme fatigue, rapid weight gain from fluid retention, or irregular heartbeats. These symptoms warrant immediate medical contact regardless of when your next scheduled follow-up occurs.
Specific Echo Findings – What Each One Means for Your Health
Heart Failure on Echocardiogram
Heart failure on echocardiogram manifests through multiple specific findings that distinguish systolic from diastolic dysfunction. The National Institutes of Health echocardiography research demonstrates that echocardiogram results provide the primary diagnostic tool for classifying heart failure subtypes and guiding treatment strategies.
Systolic heart failure appears on echocardiogram findings explained reports as reduced ejection fraction (HFrEF), typically below 40%, with dilated left ventricular chamber and globally decreased wall motion. Patients see descriptions like “global hypokinesis” or “diffusely reduced systolic function” indicating the entire ventricle contracts weakly rather than specific regional problems.
Diastolic heart failure (HFpEF) presents different patterns on echocardiogram results. The ejection fraction remains preserved above 50%, but Doppler measurements reveal stiff, non-compliant heart muscle according to Hagerstown Community College diastolic dysfunction protocols. The E/A ratio (early to atrial filling) reverses from normal patterns, and elevated E/e’ ratios above 14 indicate increased left atrial pressure.
Low ejection fraction meaning extends beyond a simple number—it predicts prognosis and guides therapy. Patients with EF 30-40% face moderate heart failure requiring ACE inhibitors, beta-blockers, and often diuretics. Those below 30% need aggressive medical management plus consideration for implantable cardioverter-defibrillators (ICDs) to prevent sudden cardiac death from arrhythmias.
What This Means For You: Living with Reduced Ejection Fraction
Patients receiving abnormal echocardiogram results showing reduced EF should optimize their sleep patterns since poor sleep quality worsens heart failure outcomes through neurohormonal activation and fluid retention. Daily weight monitoring helps detect early fluid accumulation before symptoms develop—gain of 3 pounds in one day or 5 pounds in one week signals need for medication adjustment.
Valve Disease Findings Deep Dive
Mitral valve regurgitation echo severity determines treatment timing and surgical intervention. Mild MR (regurgitant volume <30 mL per beat) requires monitoring every 2-3 years if asymptomatic. Moderate MR (30-59 mL) needs annual surveillance with attention to left atrial enlargement and ejection fraction trends. Severe MR (≥60 mL or regurgitant fraction ≥50%) warrants cardiology referral for repair or replacement consideration.
Aortic stenosis echocardiogram measurements focus on three key parameters: valve area, mean gradient, and peak velocity. The National Heart, Lung, and Blood Institute valve replacement research shows transcatheter aortic valve replacement (TAVR) now offers alternatives to open-heart surgery for high-risk patients with severe stenosis.
Progression rates vary considerably—some patients remain stable for years while others deteriorate rapidly. Annual monitoring captures worsening stenosis before symptoms develop, since onset of chest pain, syncope, or dyspnea indicates advanced disease requiring urgent intervention.
Patient Story: John’s Journey from Moderate Stenosis to Treatment
John Patterson, 68, discovered moderate aortic stenosis during a routine echo ordered for hypertension evaluation. “My doctor said we’d watch it closely,” John explains. Over three years, his valve area decreased from 1.2 cm² to 0.8 cm² despite no symptoms. Serial echocardiogram results documented progressive narrowing, prompting TAVR before symptoms emerged. “The procedure changed my life—I feel better than I did five years ago,” he reports. His proactive monitoring and timely intervention prevented heart failure development.
Tricuspid regurgitation severity relates to right ventricular pressure and function. Echocardiogram findings explained might describe “severe TR secondary to pulmonary hypertension” indicating the leak results from elevated lung pressures rather than primary valve disease. Treatment focuses on addressing underlying pulmonary hypertension.
Cardiomyopathy on Echo
Echocardiogram results distinguish three major cardiomyopathy types through characteristic patterns outlined in NIH cardiomyopathy diagnostic guidelines.
Dilated cardiomyopathy shows enlarged left ventricular chamber (>6.0 cm diameter), reduced ejection fraction typically 25-40%, and thinned walls. Global hypokinesis affects all segments uniformly, unlike regional abnormalities from coronary disease. Many patients have concurrent mitral and tricuspid regurgitation from chamber dilation.
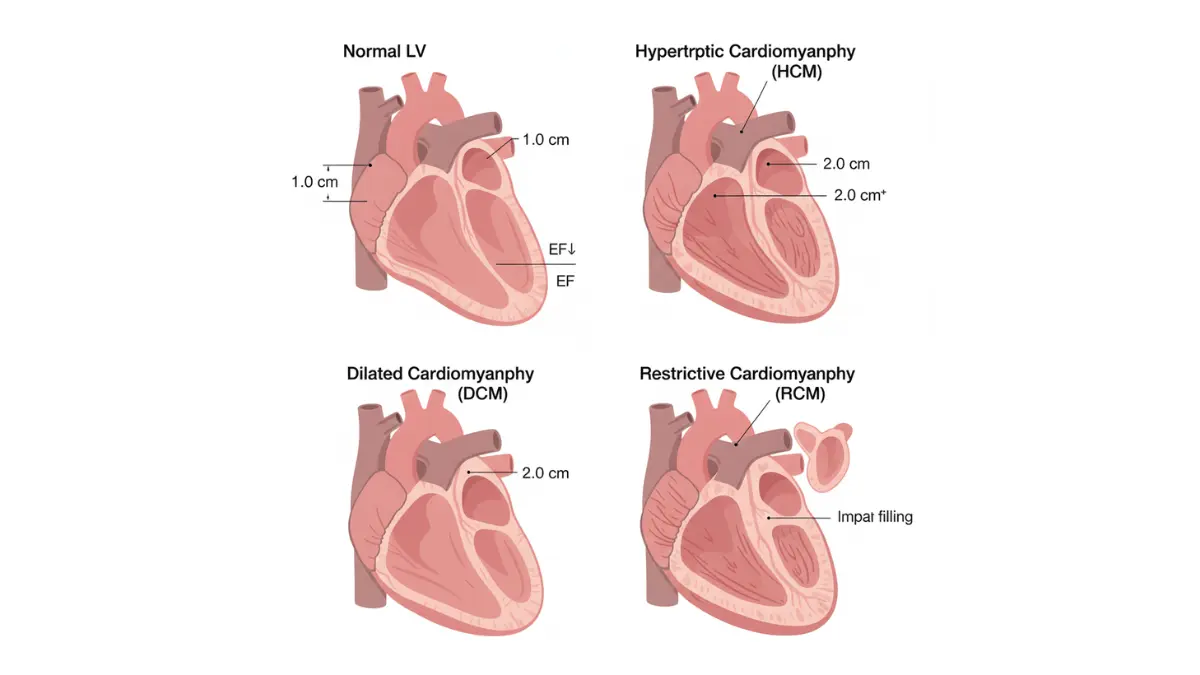
Hypertrophic cardiomyopathy (HCM) demonstrates thickened septum (≥15 mm) with preserved or hyperdynamic systolic function. The classic pattern shows asymmetric septal hypertrophy with left ventricular outflow tract obstruction. Systolic anterior motion of the mitral valve creates dynamic gradients and secondary regurgitation.
Restrictive cardiomyopathy presents normal chamber sizes with severely impaired diastolic filling. Biatrial enlargement appears prominent relative to ventricular size. Doppler patterns show restrictive filling with shortened deceleration time and elevated E/A ratios.
Other Important Findings
Pericardial effusion classification depends on size: small (<1 cm echo-free space), moderate (1-2 cm), or large (>2 cm). Hemodynamic significance matters more than size—tamponade physiology with chamber collapse requires urgent drainage regardless of fluid volume.
Atrial enlargement (left atrium >4.0 cm anteroposterior diameter) increases atrial fibrillation risk substantially. Echocardiogram results showing enlarged atria prompt rhythm monitoring and anticoagulation consideration.
Wall motion abnormalities post-infarction demonstrate hypokinesis (reduced motion), akinesis (no motion), or dyskinesis (paradoxical outward bulging) in coronary artery distribution territories. These findings help identify patients needing revascularization procedures.
Intracardiac masses require distinction between thrombus, tumor, and vegetation. Location provides clues—left atrial appendage clots in atrial fibrillation, left ventricular apical thrombi post-infarction, and valve vegetations in endocarditis.
After Your Echo Results – Next Steps and Treatment Paths
Interpreting Your Results with Your Doctor
Interpreting echocardiogram results requires a collaborative conversation with your cardiologist who can translate technical findings into personalized health guidance. Request a detailed explanation of each measurement, particularly if your report shows abnormal echocardiogram results requiring follow-up testing or treatment modifications.
Essential questions to ask your cardiologist about echocardiogram results include: What do my ejection fraction and valve findings mean for my daily activities? How often should I repeat echocardiography based on my specific findings? Which symptoms should prompt immediate medical attention versus routine follow-up? Do my results require medication changes, lifestyle modifications, or procedural interventions?
Requesting a copy of your echo report empowers you to track trends over time and ensures continuity when consulting specialists. Most hospitals now provide patient portal access to imaging results, though the technical terminology benefits from professional interpretation before drawing conclusions.
Follow-up echo timing varies based on findings—normal echocardiogram results in asymptomatic patients might warrant repeat testing in 3-5 years, while moderate valve disease requires annual surveillance. Severe abnormalities often necessitate echos every 3-6 months to monitor progression and optimize intervention timing.
Second opinions become appropriate when echocardiogram findings explained by your physician suggest major interventions like valve replacement or when you feel uncertain about recommended treatment courses. Academic medical centers with dedicated valve clinics provide specialized expertise for complex cases.
Conversation Starter Script: Five Questions for Your Doctor
- “Can you explain what my ejection fraction of [X%] means for my heart’s pumping ability?”
- “My report mentions [valve finding]—how severe is this and what symptoms should I watch for?”
- “Based on my results, when should I schedule my next echocardiogram?”
- “Are there lifestyle changes or medications that could improve my findings?”
- “Under what circumstances should I seek emergency care related to these results?”
Treatment Paths Based on Results
Understanding echocardiogram results guides evidence-based treatment selection from lifestyle interventions to surgical procedures. Borderline findings often respond to cardiovascular risk factor management including blood pressure control, weight optimization through a weight loss calculator, and sodium restriction to reduce cardiac workload.
Medication options for valve disease and heart failure on echocardiogram include ACE inhibitors or ARNIs that reduce afterload, beta-blockers that slow heart rate and decrease myocardial oxygen demand, mineralocorticoid receptor antagonists that prevent adverse remodeling, and SGLT2 inhibitors that improve outcomes even without diabetes according to Oxford Academic cardiac rehabilitation research.
Surgical or procedural intervention becomes necessary when echocardiogram results demonstrate severe symptomatic valve disease, critical stenosis with pressure gradients suggesting imminent decompensation, or reduced ejection fraction refractory to optimal medical therapy. Transcatheter approaches increasingly offer less invasive alternatives to traditional open-heart surgery for appropriate candidates.
Cardiac rehabilitation programs provide structured exercise training, nutritional counseling, and psychosocial support for patients with abnormal echocardiogram results including heart failure or post-cardiac surgery. The Wake Forest University cardiac rehabilitation program demonstrates that supervised exercise improves functional capacity, quality of life, and mortality rates when combined with pharmacologic management.
| Echo Finding | First-Line Treatment | When Surgery/Procedures Needed | Expected Success Rates |
|---|---|---|---|
| Moderate MR | Afterload reduction, diuretics | Progressive LV dilation or symptoms | 95% 5-year survival post-repair |
| Severe AS | Medical monitoring if asymptomatic | Symptoms, EF decline, or valve area <1.0 cm² | TAVR 98% procedural success |
| EF 30-40% | Guideline-directed medical therapy | Refractory symptoms despite medications | 60-80% improvement with optimal therapy |
| Severe TR | Diuretics, pulmonary HTN treatment | Severe symptoms with RV dysfunction | 85-90% symptomatic improvement |
Complementary approaches including sodium restriction to less than 2000mg daily, regular aerobic exercise calibrated through heart rate zone monitoring, stress management techniques, and adequate sleep optimization support cardiovascular health alongside conventional treatments.
Insurance, Costs, and Access
Follow-up echocardiogram coverage through Medicare Part B includes 80% payment after deductible when deemed medically necessary according to Medicare cardiovascular screening guidelines. Private insurance plans typically cover surveillance echos based on established clinical appropriateness criteria, though frequency limits may apply.
Prior authorization requirements increasingly impact cardiac imaging access, with insurers requiring documentation that repeat echocardiography will change management before approval. Understanding your plan’s specific policies prevents unexpected denials and billing issues.
Financial assistance programs through hospital charity care departments, pharmaceutical patient assistance initiatives, and nonprofit cardiovascular foundations help patients without adequate insurance coverage access necessary testing and treatment.
Regional access disparities affect rural populations who may travel hours to reach cardiac imaging centers with specialized echocardiography equipment and board-certified cardiologists. Telemedicine consultations expand specialty access for echocardiogram results interpretation when local expertise is unavailable.
Living with Your Results
Emotional support resources become critical when abnormal echocardiogram results trigger anxiety about cardiac health and mortality. The American Heart Association offers peer support groups, educational webinars, and counseling referral services for patients navigating cardiovascular disease diagnoses.
Lifestyle adjustments based on specific findings might include activity restrictions for severe aortic stenosis, fluid and sodium monitoring for heart failure, and infection prevention through dental hygiene for significant valve disease. Your cardiologist provides personalized guidance matching limitations to your individual physiology.
Emergency care becomes necessary if you experience chest pain lasting more than a few minutes, sudden severe shortness of breath, fainting episodes, rapid irregular heartbeat, or leg swelling with breathing difficulty—symptoms potentially indicating acute decompensation requiring immediate evaluation regardless of your last echocardiogram results.
Frequently Asked Questions About Echocardiogram Results
1. What is a normal ejection fraction on an echocardiogram?
A normal ejection fraction ranges from 55-70%, indicating your heart pumps more than half its blood volume with each beat. Values between 50-55% are borderline, while anything below 50% suggests reduced pumping function requiring medical evaluation.
2. What does mild mitral regurgitation mean on echo results?
Mild mitral regurgitation means your mitral valve leaks slightly, allowing minimal backward blood flow. This finding rarely causes symptoms or requires treatment, but needs monitoring every 2-3 years to ensure it doesn’t progress to moderate or severe levels.
3. How serious is an ejection fraction of 40%?
An ejection fraction of 40% indicates mildly reduced heart function (HFmrEF) requiring medical treatment. While not immediately life-threatening, it warrants cardiology referral, medications like ACE inhibitors and beta-blockers, and lifestyle modifications to prevent further decline.
4. What does “trace” regurgitation mean on an echocardiogram?
Trace regurgitation represents the mildest possible valve leak, considered normal in up to 70% of healthy adults. This benign finding requires no treatment or follow-up unless accompanied by other abnormalities or cardiac symptoms.
5. Can echocardiogram results improve over time?
Yes, echocardiogram results can improve with proper treatment. Ejection fraction may increase with heart failure medications, valve regurgitation can stabilize with blood pressure control, and chamber sizes may normalize with weight loss and cardiovascular risk factor management.
6. How often should I repeat an echocardiogram if abnormal?
Mild abnormalities require repeat echos every 2-3 years, moderate findings need annual monitoring, and severe abnormalities warrant testing every 3-6 months. Your cardiologist determines the specific interval based on disease severity and progression risk.
7. What is considered a low ejection fraction?
Ejection fraction below 40% is considered low, indicating heart failure with reduced ejection fraction (HFrEF). Values of 30-40% represent moderate dysfunction, while anything under 30% signifies severe heart failure requiring aggressive medical management and possible device therapy.
8. Can a normal echocardiogram rule out heart disease?
No, a normal echocardiogram doesn’t rule out all heart disease. While it excludes structural problems, valve disease, and pumping dysfunction, it cannot detect coronary artery blockages, rhythm disorders, or microvascular disease, which require additional testing like angiography or EKG.
9. What does preserved ejection fraction mean?
Preserved ejection fraction (HFpEF) means your heart pumps normally (EF ≥50%) but doesn’t relax properly between beats. This diastolic dysfunction causes heart failure symptoms despite normal pumping strength, requiring different treatment than reduced ejection fraction heart failure.
10. Should I worry about borderline left ventricular hypertrophy?
Borderline left ventricular hypertrophy (wall thickness 11-12mm) warrants investigation but usually responds well to treatment. Common causes include high blood pressure and obesity. Blood pressure control, weight loss, and sodium restriction often prevent progression to definite hypertrophy.
11. What does severe aortic stenosis look like on echo?
Severe aortic stenosis on echocardiogram shows valve area less than 1.0 cm², mean gradient above 40 mmHg, and peak velocity exceeding 4.0 m/s. This critical narrowing requires cardiology evaluation for valve replacement, especially if accompanied by symptoms like chest pain or fainting.
About this content
This medical content is prepared through a structured publishing workflow with expert writing, clinical review and editorial quality checks.

Board Certifications: Internal Medicine (2006); Cardiovascular Disease (2009); Clinical Lipidology (2014) Experience: 19 years | Location: Delhi, India Education: MBBS, Maulana Azad Medical College (2003); MD Internal Medicine,…

Board Certifications: Internal Medicine (1995); Geriatric Medicine (2000); Hospital Medicine (2008) Experience: 30 years | Location: Dubai, UAE Education: MBBS, Cairo University Faculty of Medicine (1992); MD Internal…

Board Certifications: Internal Medicine (1998); Endocrinology, Diabetes & Metabolism (2001) Experience: 27 years | Location: Chennai, India Education: MBBS, Madras Medical College (1995); MD Internal Medicine, CMC Vellore…
Medical disclaimer
The content on MyMedicineAdvisor is provided for general informational and educational purposes only and is not a substitute for professional medical advice, diagnosis, or treatment. Health information on this website should not be used to diagnose, treat, cure, or prevent any condition without guidance from a qualified healthcare professional. Always seek the advice of your doctor, physician, or another licensed healthcare provider with any questions you may have regarding a medical condition, symptoms, medications, or treatment decisions.