
On This Page – Quick Medical Summary
Start here: find your number, then read across
You have a number and want to know which row it belongs to. The chart is below — one thing first, because it changes how the chart reads.
Find yourself here:
- Your result came back near one of the lines — the chart, then why the lines aren’t cliffs.
- You already have diabetes and you’re tracking your number — the section on 7.0 was written for you.
- You’re reading someone else’s report — the chart, then when it doesn’t apply.
- You don’t have a result yet — the chart, then what each band sets in motion.
An A1C test is a blood test measuring the share of your red blood cells carrying glucose-coated hemoglobin — your average blood glucose over roughly three months.
Here is what most charts leave out. These numbers are not all the same kind of number. Some decide whether you have a condition. Others are targets for people who already do. This page keeps them apart, because mixing them is where the confusion starts.
ℹ️ Medical Disclaimer: Educational only. This page does not diagnose, interpret your individual result, adjust medication, or advise on coverage. A1C results are read alongside your full clinical picture by a qualified clinician. Do not change any medication, monitoring routine or eating pattern based on it — speak with a board-certified primary care physician or endocrinologist first. With symptoms of very high blood sugar, seek care promptly.
The A1C chart: normal, prediabetes and diabetes
| A1C result | What it’s called | Key clinical detail: what this number is for | Estimated average glucose |
|---|---|---|---|
| Below 5.7% | Normal | A diagnostic line | Below about 117 mg/dL* |
| 5.7% to 6.4% | Prediabetes | A diagnostic line | About 117 to 137 mg/dL* |
| 6.5% or above | Diabetes | A diagnostic line | About 140 mg/dL and above* |
| Below 7% | A common treatment goal | A goal, not a diagnosis | 154 mg/dL at 7.0% |
Diagnostic bands: CDC and NIDDK. Treatment goal: CDC. *Asterisked glucose figures are calculated, not published — see the eAG section.

What the three diagnostic bands are
The first three rows decide something. They come from the CDC’s A1C ranges; NIDDK publishes the same three independently.
Why “6.5% or above” is the exact wording
A result of exactly 6.5% meets the criterion for diabetes. It isn’t above the line — it is the line, and the line counts. Wording varies across published sources; some say “over 6.5%,” which reads as though 6.5 sits outside. Both federal sources state 6.5% or above.
What the chart can’t tell you on its own
NIDDK attaches a footnote that most reproductions drop: any test used to diagnose diabetes requires confirmation with a second measurement, unless there are clear symptoms. One number on one day is not a diagnosis.
🔬 How It Works: Glucose attaches to hemoglobin, the oxygen-carrying protein inside red blood cells. The more glucose, the more hemoglobin ends up coated. Red cells live about three months, so measuring the coated share gives an average across that window rather than a snapshot.
Why 7.0 isn’t on the same scale as 5.7 and 6.5
7.0 is not a diagnostic number. It is a treatment goal — a target for someone who already has a diabetes diagnosis, not a threshold that creates one. That one distinction explains most of what looks contradictory on an A1C chart.

Diagnostic lines are drawn once
5.7 and 6.5 answer one question: does this person have this condition? They are fixed for adults, identical in every clinic, and do their work once.
Treatment goals are drawn afterwards, and they’re personal
After a diagnosis the question becomes where a person’s number should sit. The CDC states that for most people with diabetes the A1C goal is 7% or less. NIDDK adds that a level safe for one person may not be safe for another, and that a less strict 7% to 8% may suit someone with limited life expectancy, long-standing diabetes, hypoglycemia unawareness or advanced complications. The American Diabetes Association’s Standards of Care in Diabetes—2026 gives the same figure for many nonpregnant adults.
The number that appears on both lists
6.5 is on both. It diagnoses diabetes in someone who doesn’t have it — and the ADA’s 2026 Standards also give below 6.5% as a stricter goal for some people who already do, where health is good and treatment risk is low. Same number, opposite jobs.
📊 Clinical Data Point: For most people with diabetes, the A1C goal is 7% or less — Source: CDC, A1C Test for Diabetes and Prediabetes. This matters just as much: the CDC states that reaching an A1C below 6.5% with treatment does not mean the condition went away. The bands diagnose in one direction only.
✅ Patient Action: Ask your primary care physician or endocrinologist: “What A1C goal are you setting for me, and what made you choose that number rather than a standard one?”
What each band on the chart actually triggers next
Each row sets a different process in motion. None ends with a number on a screen.
If your result is in the normal band
Your clinician sets the re-testing schedule based on age and risk factors, per the CDC. Worth asking when the next test is due and noting the date — an A1C reads better as a trend than as a single point. It often arrives inside a routine annual blood work panel.
If your result is in the 5.7 to 6.4 band
This is the prediabetes band. The CDC’s stated pattern is a repeat A1C every one to two years alongside a conversation about lowering risk. What clinicians check next in this range is a longer answer than this page should give: what happens next in the 5.7 to 6.4 band. Blood sugar rarely moves alone, so it’s worth seeing which other markers tend to move with it.
If your result is 6.5 or above
NIDDK is specific: without clear symptoms, a repeat test on a different day is expected before a diagnosis — another A1C, or a different diabetes test such as a fasting plasma glucose or oral glucose tolerance test. A second test is standard procedure, not a sign that something looks worse.
✅ Patient Action: Ask your primary care physician: “Is this result being confirmed with a second test, and when is it scheduled?”
Why these are lines on a slope, not cliffs
The bands are drawn across something continuous. Nothing changes in your body at 5.69% that changes at 5.71%.
Risk rises across the band, not at the edge of it
NIDDK states that within the prediabetes range of 5.7 to 6.4 percent, the higher the A1C the greater the risk of diabetes. The ADA’s 2026 Standards describe that risk as continuous and curvilinear, rising disproportionately as the number climbs. A 5.8 and a 6.3 both read “prediabetes” and are not the same situation.
What “your result is a range” means in practice
📊 Clinical Data Point: A result reported as 6.8% could be reported anywhere from 6.4% to 7.2% on a repeat test of the same blood sample — Source: NIDDK, The A1C Test & Diabetes, last reviewed April 2018. That margin is precisely why a diagnosis requires a second measurement, not a reason to doubt the first. NIDDK notes the range used to be wider, and that newer, stricter quality-control standards have made results more precise.
This describes how measurement behaves. It is not a rule to apply to your own number, and it does not mean a 6.6 might “really” be a 6.2. Labs handle it as they do elsewhere — by repeating a result before acting on it. The full picture of how precise an A1C result is sits in our main guide.
The eAG column: your A1C in mg/dL
What the eAG numbers are
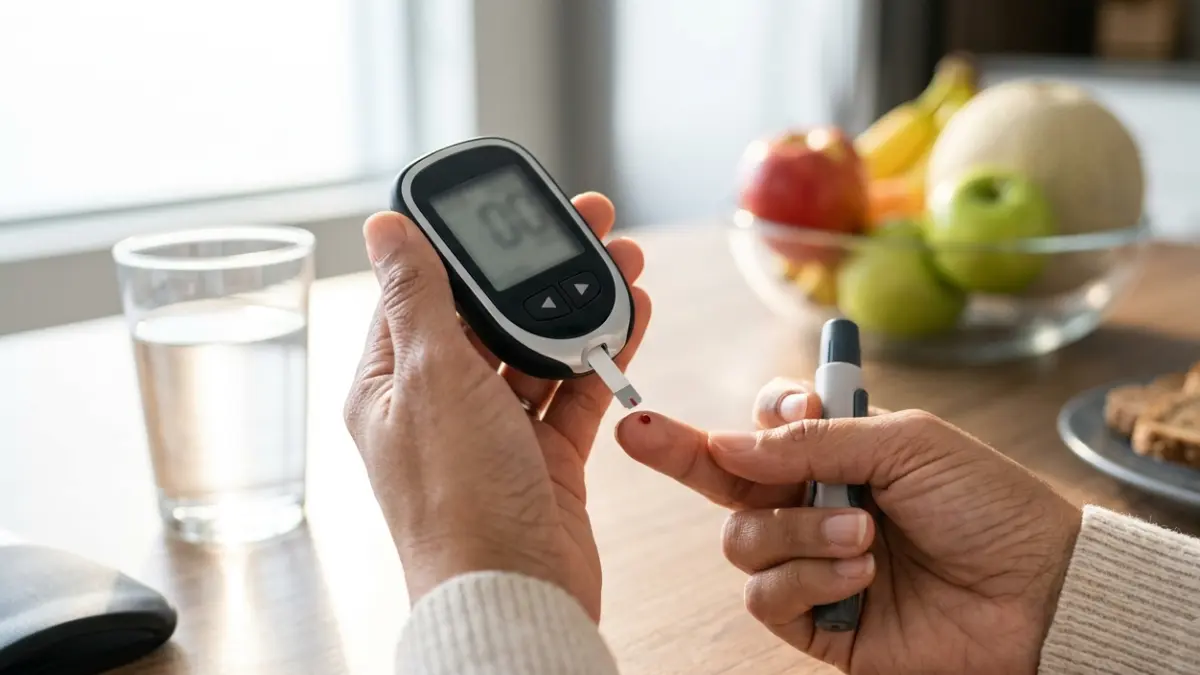
Many charts carry a second column in mg/dL: estimated average glucose, or eAG — your A1C in the units a home meter uses.
| A1C | Estimated average glucose |
|---|---|
| 6% | 126 mg/dL |
| 7% | 154 mg/dL |
| 8% | 183 mg/dL |
| 9% | 212 mg/dL |
| 10% | 240 mg/dL |
| 12% | 298 mg/dL |
Source: CDC. Values at 5.7%, 6.4% and 6.5% aren’t published by the CDC; those figures in the first table were calculated by us using the formula below.
Why eAG won’t match your meter
NIDDK is direct: the eAG number will not match your daily readings, because it is a long-term average rather than a level at one moment. A meter reading of 190 on a Tuesday afternoon doesn’t contradict an eAG of 154.
If your report says mmol/mol
Some countries report A1C in mmol/mol; US labs report the percentage. On that scale 6.5% is 48 mmol/mol and 7% is 53. To move between mg/dL and mmol/L, our blood sugar unit converter does the arithmetic. See also normal blood sugar ranges and what one high glucose result can mean.
🔬 How It Works: eAG isn’t measured. It’s calculated from your A1C: eAG (mg/dL) = 28.7 × A1C − 46.7, an equation from the international A1C-Derived Average Glucose study of 507 adults. The ADA’s 2026 Standards call the results rough equivalents — the honest way to read that column.
When the chart doesn’t apply to your result
A standard chart assumes a standard result. Several situations mean yours needs a clinician’s eye rather than a table.
Is there an A1C chart by age?
Not for diagnosis. The CDC and NIDDK both state the thresholds for adults with no age adjustment. Age does change treatment goals — the ADA’s 2026 Standards describe less stringent targets, such as below 8.0%, with significant cognitive or functional limitations, frailty or severe other conditions. Charts showing “normal A1C by age” blend an age-varying goal with a fixed diagnostic line, which is how 6.6% at 62 can read as reassuring when it isn’t.

Conditions that can change your A1C result
Per the CDC: severe anemia, kidney failure, liver disease, sickle cell anemia or thalassemia, certain medicines including opioids and some HIV medicines, blood loss or transfusion, and early or late pregnancy. NIDDK adds that very low iron pushes a result falsely high — relevant if you’ve been told about low hemoglobin or had abnormal iron studies.
The form of hemoglobin you carry is inherited. Less common forms, called hemoglobin variants, are more common in people whose ancestors came from Africa, South and Southeast Asia or the Mediterranean, and they interfere with some A1C testing methods, not all. Most carriers have no symptoms. The fix is a different method, which the lab selects.
Results the chart was never meant to read
NIDDK states the A1C test should not be used to diagnose type 1, gestational or cystic fibrosis-related diabetes, and that point-of-care results run in an office shouldn’t be used for diagnosis. MedlinePlus frames its use the same way. An A1C isn’t on a standard metabolic panel either — here’s why one can’t stand in.
⚠️ Clinical Warning: We don’t recommend or link to any at-home A1C product, and take no affiliate revenue from one. Our own sources are the reason: NIDDK says point-of-care results shouldn’t be used for diagnosis, and the leading consumer device’s own labelling says it isn’t for screening or diagnosis of diabetes.
✅ Patient Action: Ask your primary care physician: “Is there anything about my blood — anemia, a hemoglobin variant, kidney or liver disease, a recent transfusion — that could make my A1C read falsely high or low?”
A1C chart questions people ask most
1. Is an A1C of 5.7 diabetes?
No. On the A1C chart, 5.7% is the bottom edge of the prediabetes band, which runs from 5.7% to 6.4%. Diabetes begins at 6.5% or above. A 5.7 does mean your result has crossed out of the normal range, and both the CDC and NIDDK treat that as a signal worth acting on rather than ignoring.
2. Is 6.5 diabetes or prediabetes?
Exactly 6.5% meets the criterion for diabetes, not prediabetes. The wording on the A1C chart is “6.5% or above,” so the number itself counts rather than sitting just outside. Without clear symptoms, a repeat test on a different day is expected before a diagnosis is confirmed. Discuss the result and the confirmatory test with your primary care physician.
3. Is an A1C of 7.0 bad?
7.0 isn’t a diagnostic number. It’s a treatment goal — the CDC states that for most people with diabetes the A1C goal is 7% or less. Whether 7.0 is where you should be depends on your own history, and NIDDK notes a level safe for one person may not be safe for another. Ask your clinician what target they’ve set for you.
4. What is a normal A1C by age?
There is no age-adjusted diagnostic threshold. The bands on the A1C chart apply to adults regardless of age, per both the CDC and NIDDK. What does change with age and overall health is the treatment goal for people who already have diabetes. Charts labelled “normal A1C by age” blend those two different things and can read as falsely reassuring.
5. Can one A1C result diagnose diabetes?
Usually not on its own. NIDDK states that without clear symptoms, a repeat test on a different day is needed to confirm — either another A1C or a different diabetes test such as a fasting plasma glucose or oral glucose tolerance test. A second test is routine procedure. Ask your primary care physician when the confirmatory test is scheduled.
6. What is 6.5% A1C in mg/dL?
Roughly 140 mg/dL as an estimated average glucose. The CDC publishes eAG values starting at 6% (126 mg/dL); the figure for 6.5% is calculated from the standard conversion formula shown in the eAG section above rather than published directly. Treat it as an estimate of a three-month average, not a reading you would see on a meter.
7. Why does my report say mmol/mol?
Some countries report A1C in mmol/mol rather than as a percentage; US labs report the percentage. The two describe the same result on different scales. On the mmol/mol scale, 6.5% is 48 and 7% is 53. If your report shows an unfamiliar unit, check which scale your lab used before comparing it against any A1C chart you find online.
8. Is 5.8 close enough to normal to ignore?
5.8% sits inside the prediabetes band. NIDDK states that within 5.7 to 6.4 percent, risk climbs as the number climbs, so a 5.8 is a genuinely different position from a 6.3. The measurement margin on any single result is a reason to confirm rather than to dismiss. Bring it to your primary care physician rather than filing it away.
9. If my A1C drops below 6.5, is my diabetes gone?
No. The CDC states plainly that reaching an A1C below 6.5% with treatment and lifestyle changes does not mean the condition went away — it usually means blood sugar is well managed. The bands on the A1C chart diagnose in one direction only. Keep your monitoring schedule and discuss any changes with your treating clinician.
10. Can an A1C chart be wrong for me?
The chart can misread a real result. Severe anemia, kidney failure, liver disease, sickle cell anemia or thalassemia, certain medicines including opioids and some HIV medicines, blood loss, transfusion and early or late pregnancy can all shift an A1C, per the CDC. Inherited hemoglobin variants affect some testing methods. Tell your clinician if any apply.
11. How often should I repeat the test?
It depends on which band you’re in. Following CDC guidance: with a normal result, your clinician sets the interval based on age and risk factors; with prediabetes, a repeat every one to two years is the usual pattern; with diabetes, most people are tested at least twice a year. Ask your primary care physician which schedule fits you.
What to do with your number this week
The most useful thing to take from an A1C chart is knowing which kind of number you’re holding. If it’s 5.7 or 6.5, the chart is answering a diagnostic question and the next step is confirmation. If it’s a target like 7.0, the chart is describing management, and the number that matters is the one your clinician set for you.
Note the date of your result and ask when the next is due. If it landed in the prediabetes band, our article on what doctors check next picks up where this one stops. If a condition on the list above applies to you, say so before your result is interpreted.
About this content
How this article was put together: researched from recognised health sources, drafted with the help of AI tools, and edited by hand, with sources linked throughout.

Sameer Patel is the founder and editor of My Medicine Advisor. He is not a doctor or medical professional — before starting this site he worked in banking,…
Medical disclaimer
The content on MyMedicineAdvisor is provided for general informational and educational purposes only and is not a substitute for professional medical advice, diagnosis, or treatment. Health information on this website should not be used to diagnose, treat, cure, or prevent any condition without guidance from a qualified healthcare professional. Always seek the advice of your doctor, physician, or another licensed healthcare provider with any questions you may have regarding a medical condition, symptoms, medications, or treatment decisions.